Who says cycles don’t exist? Today, we put cycles on full display in looking at the performance of two of the most important asset classes: Equities and Commodities.
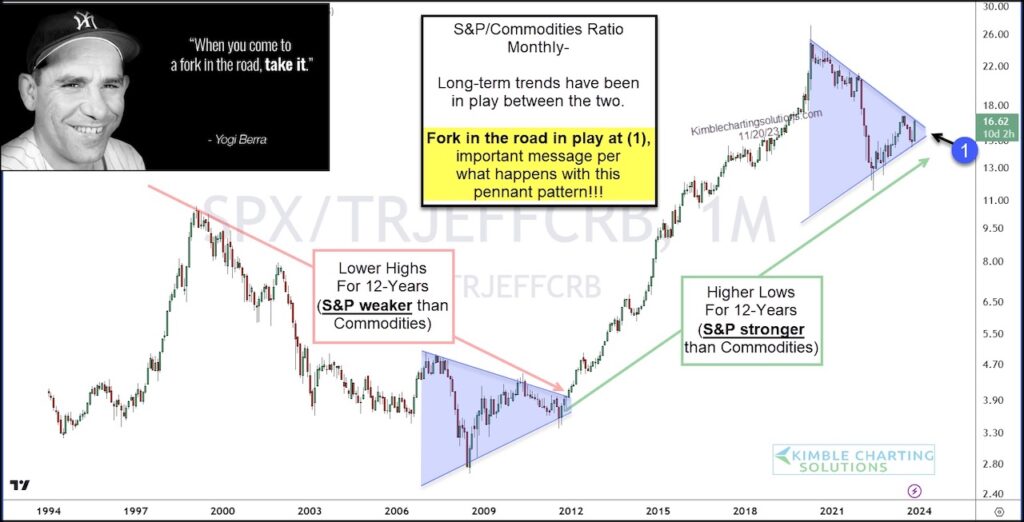
The chart below takes a long-term “monthly” view of the performance ratio of the S&P 500 Index/Thomson Reuters Commodities Index.
As you can see, a couple of long-term trends have been in play over the past 25-years. Moreover, looks like cycles of 12-years a piece (Commodities lead, then S&P 500 leads…).
Currently, a pennant pattern looks to be nearing completion at (1). The last time this pattern was in play, a long-term trend reversal took place.
Will equities continue to show strength and we see one more breakout… or will equities wilt in the face of commodities and break down.
In my humble opinion, what happens at (1), could send very important message about investment allocations! Stay tuned!
S&P 500 Index to Commodities Index “monthly” Performance Ratio Chart
Note that KimbleCharting is offering a 2 week Free trial to See It Market readers. Just send me an email to services@kimblechartingsolutions.com for details to get set up.
Twitter: @KimbleCharting
Any opinions expressed herein are solely those of the author, and do not in any way represent the views or opinions of any other person or entity.


