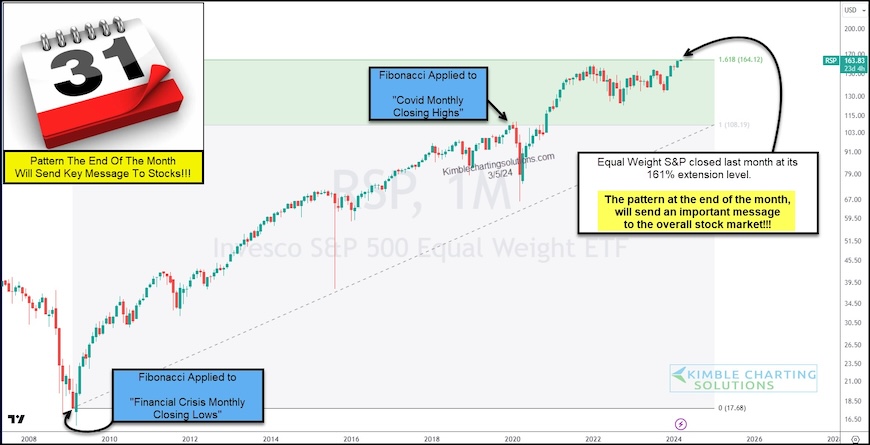
The latest stock market rally has taken several key indices to new highs.
One such index is the Equal Weight S&P 500. While this is bullish, today’s long-term “monthly” chart of the Equal Weight S&P 500 ETF (RSP) shows price running into a big Fibonacci resistance level.
As you can see, the Equal weight S&P 500 closed right at its 161% Fibonacci extension level last month.
It will be very interesting to see what type of pattern we see developing this month. Breakout? Or bearish reversal lower?
What happens next should send an important message to stocks! Stay tuned!!
Equal Weight S&P 500 “monthly” Chart
Note that KimbleCharting is offering a 2 week Free trial to See It Market readers. Just send me an email to services@kimblechartingsolutions.com for details to get set up.
Twitter: @KimbleCharting
The author may have a position in mentioned securities. Any opinions expressed herein are solely those of the author, and do not in any way represent the views or opinions of any other person or entity.


 Flirting With Critical Support… Again")


