Rising volatility, underperforming equities (as an asset class) and a stronger US Dollar have seen the Emerging Markets ETF (EEM) suffer.
EEM has traded in a broad sideways range for several months and more recently is trading toward the bottom of that range.
Today we highlight that range, as well as two nearby supports that emerging markets bulls will need to hold to avoid a deeper selloff.
Note that the following MarketSmith charts are built with Investors Business Daily’s product suite.
I am an Investors Business Daily (IBD) partner and promote the use of their products. The entire platform offers a good mix of tools, education, and technical and fundamental data.
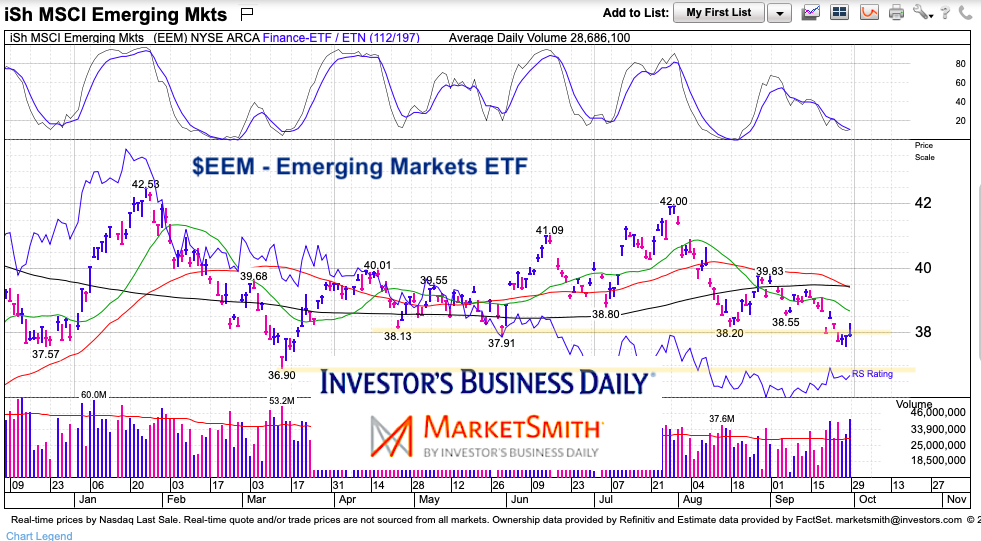
$EEM Emerging Markets ETF “daily” Chart
Today’s chart shows a trading range of roughly $37 to $42.50. EEM touched up near $42 at the end of July but has since fallen to initial support around $38. Should selling continue, the next support is the March low at 36.90. Below that and things could get ugly.
Twitter: @andrewnyquist
The author may have a position in mentioned securities at the time of publication. Any opinions expressed herein are solely those of the author, and do not in any way represent the views or opinions of any other person or entity.


