Before I dig into Elliott Wave Theory and provide some thoughts and analysis in that regard, I want to back up to a post I wrote last year on financial astrology.
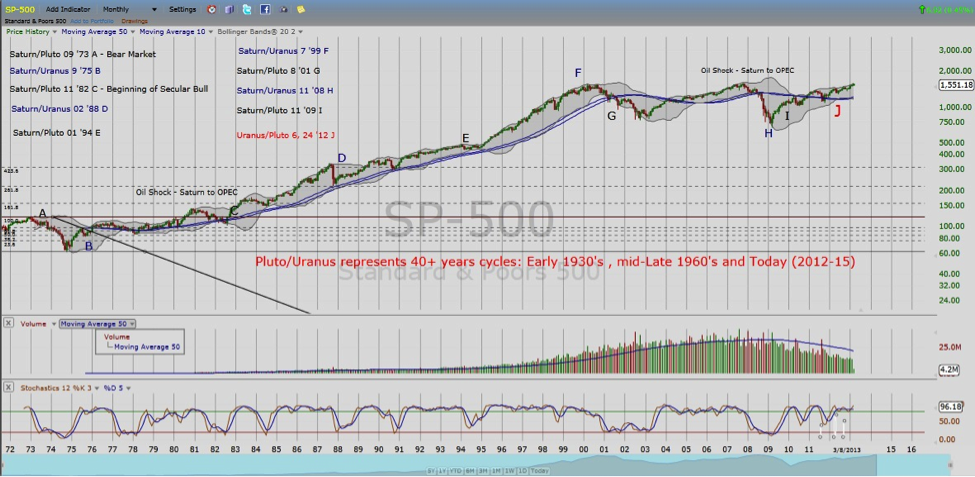
In that post, I highlighted the current Pluto-Uranus cycle, a planetary paring that happens about every 40+ years.
This pairing often coincides with secular inflationary shifts and tends to contribute to global economic instability and social unrest.
Note that the latest Pluto-Uranus Cycle period spans through 2012-2015. See chart below.
A Closer Look at Elliott Wave Theory
Financial astrology provides me with guidelines for timing the next cycle ahead, but more analysis and overlay are often required. In this instance, I incorporated Elliott Wave Theory into my analysis. Breaking down the cycle into Elliott Waves allows me to investigate the progress within the current cycle, while narrowing market expectations moving forward. Last year, my interpretation of the first Pluto-Uranus square (summer of 2012) was that it served as the peak of the global financial crisis marked by the return of inflation and the peak of the 20+ year US Treasury (TLT). Today, I question whether we’ve gotten a little ahead of ourselves. I’ll illustrate this by interpreting and illuminating the last three major waves since the market bottomed in 2009.
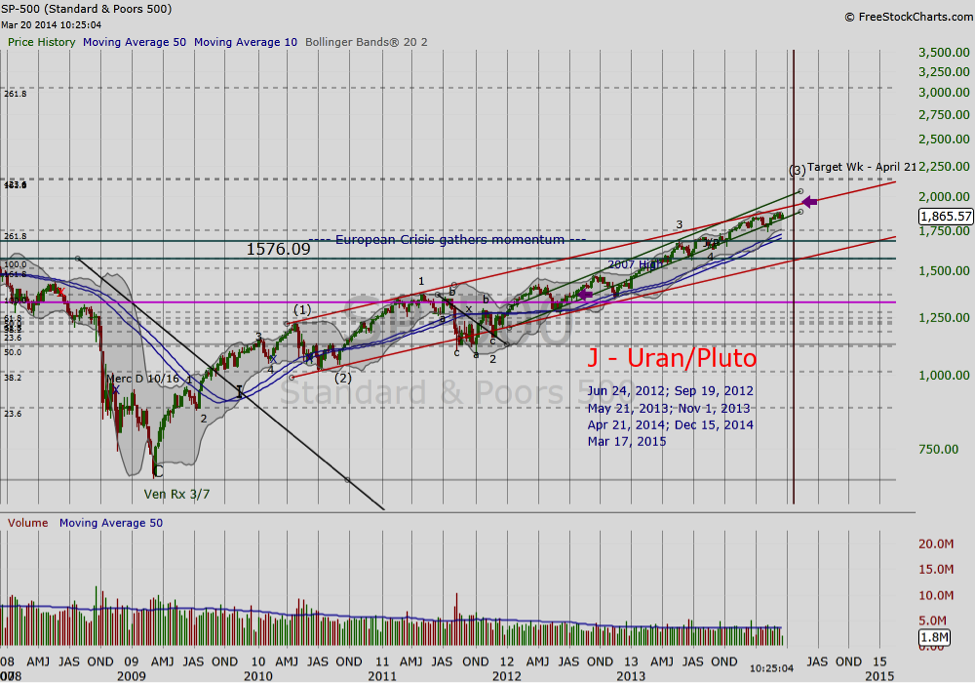
The First Wave (1)
The market bottomed March 2009 in what turned out to be one of more exciting reversals in stock market history. This wave was dominated by NASDAQ and Chinese ADR’s. The reality of globalization had arrived and ticker names, e.g. BIDU, NTES, SOHU, etc rolled off the growth trader’s tongue as easily as TSLA and FB do today.
The Second Wave (2)
Wave (2) lower was ushered in as Chinese markets had topped and the emerging crisis in Europe began to dominate the scene: Our financial crisis had become Europe’s.
The Third Wave (3)
We appear to be nearing the end of this wave. Following the summer bottom of the 2010, the S&P 500 (SPX) zigged and zagged the following two years. This two-year period was dominated by the US debt crisis, worsening conditions in the Eurozone, and global social and political unrest exacerbated by the ongoing global financial crisis. However, for those who follow the bond market, the long-term 20+ year US Treasury (TLT), had peaked following the Euro Summit in summer of 2012, and by early 2013, the TLT’s confirmed weakness signaled the return of inflation and what has become known as the Great Rotation from bonds to equities.
Concerns with Wave (3)
According to the authors of the Elliott Wave Principle, wave 3 is characterized by strength, breadth and “increasing real prosperity” (Frost and Prechter, p 79). By the latter’s description, the market should no longer question whether we are better off. Yet today, wage rates remain low and unemployment continues to be a concern. As a result, the consumer continues to struggle despite improvements in the economy. Moreover, the second chart shows volume has declined rather than rise with price. And this is contrary to what we might expect to see at the end of a third wave. Perhaps this is a byproduct of globalization, or perhaps it’s still coming. Either way, this is concerning.
1976 Anyone?
The market bumping along the top of the channel and under pressure should be no surprise to most market watchers. However, it bears watching whether it heads down next week or stubbornly treads along until April at the next Pluto-Uranus square. For old-timers or market historians, I wonder if this period may be more reminiscent of the late 1970’s when the market saw another sharp reversal to the downside rather than escape to decade higher highs? Today, this may imply that the decade-long deflationary cycle needs further construction.
References:
- Frost and Prechter (2006). Elliott Wave Principle: Key to Market Behavior. New Classics Library: GA.
- Charts created on FreeStockCharts.
No position in any of the mentioned securities at the time of publication. Any opinions expressed herein are solely those of the author, and do not in any way represent the views or opinions of any other person or entity.


