We knew to focus on Semiconductors as a leader for the last couple of weeks, until the topping price action after the big spike higher.
Last week we turned our attention to Retail and the impact it would have on Transportation and then the Russell 2000.
We talked about using 2-day confirmations on phase changes and topping patterns.
Everything confirmed.
We also noted that with the 1stquarter ending Friday, the market could put in a good show or create a pleasing “window dressing.”
Indeed, it did.
So, now that we are getting ready for the beginning of the 2ndquarter, what do the weekly charts tell us?
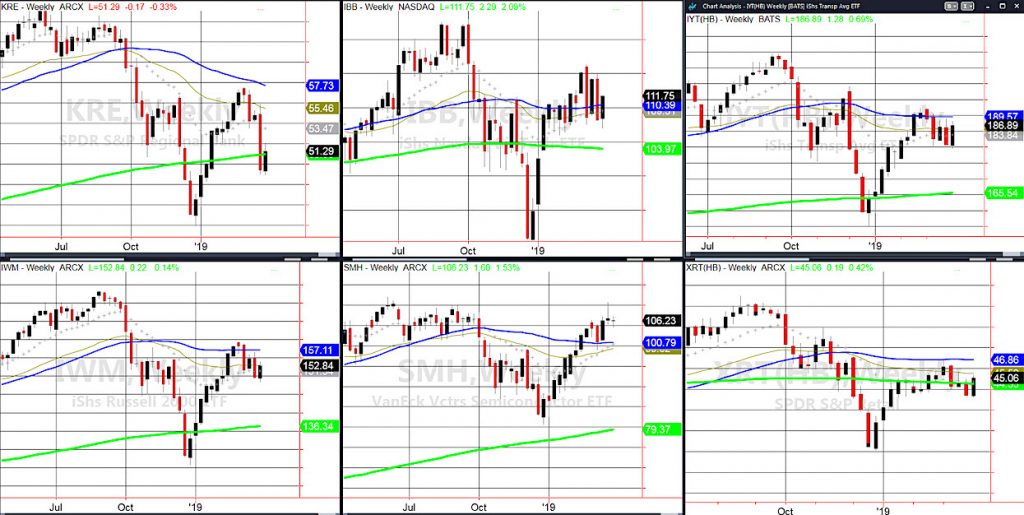
Starting from top left to right.
Regional Banks KRE, cleared back over its 200-week moving average (green line). However, we will look for a close over 50.95 next week. The Daily chart shows a bearish phase. Should that 50.95 level break down, look here as a drag on the rest of the market.
Biotechnology IBB is back over its 50-WMA (blue line). We will also look for a second close over 110.40 for the coming week for this to confirm.
Secondly, IBB entered an unconfirmed accumulation phase clearing the 200-DMA at 111.19. So there’s your second level to hold for Monday. This highly speculated sector indicates the public feels its safe to go long again.
Far right is Transportation IYT. On the Daily chart, this confirmed the recuperation phase. On the weekly chart, IYT still has its work cut out for it to get to the 50-WMA at 189.57.
Bottom left is the Russell 2000 IWM. Like IYT, it confirmed the recuperation phase on the Daily chart. Also like IYT, it has its work cut out for it to get near the 50-WMA at 157.11.
In the middle is Semiconductors SMH. Remember that SMH had a topping pattern on March 21st. It is still working that pattern. Although on the weekly charts, SMH is bullish. That means SMH either must clear the 3/21 high or under 104 could spell trouble.
Last but not least, the one that stopped the bleed and started the rally last week is Retail XRT. Retail confirmed the Recuperation phase on the Daily and cleared the 200-WMA on the weekly. That makes 44.50 the major area to hold up.
How will the Family keep you ahead of the curve?
Watch IYT IWM and XRT-they must hold recent gains and IWM IYT have to find their way up to the 50-WMAs. If not, watch to see if XRT fails 44.50, and KRE fails 50.95. Safe bet that will bring back selling.
If IYT XRT and IWM hold their 50-DMA, then I’d expect another good rally up to the resistance levels on the weekly charts. At that point, we reassess.
S&P 500 (SPY) – Cleared 281.20 the 10 DMA which makes that support for Monday. Still working a topping pattern for now
Russell 2000 (IWM) – Confirmed the Recuperation phase. 152.25 the immediate support to hold. Through 154.55 a better chance for more upside
Dow Jones Industrials (DIA) – 257.27 now the support to hold. 262.36 was the high on 2/25 and remains the topping pattern price to clear
Nasdaq (QQQ) – 179.15 the 10-DMA to hold as support. Like SPY, still working a topping pattern.
KRE (Regional Banks) – 50.95 the 200-week moving average cleared and must hold this week
SMH (Semiconductors) – 106.40 is the 10-DMA and pivotal point for Monday.
IYT (Transportation) – Confirmed recuperation phase if holds 184.50 with lots of resistance at 189.20-189.60
IBB (Biotechnology) – 110.32 support and 111.18 the 200-DMA this must close above again for a confirmed accumulation phase
XRT (Retail) – 45.50 resistance and 44.65 area the support
Twitter: @askslim
Twitter: @marketminute
The author may have a position in the mentioned securities at the time of publication. Any opinions expressed herein are solely those of the author, and do not in any way represent the views or opinions of any other person or entity.


")


 Ready To Break Out?")
