Market Expectations Catch Up to Data but Actual Activity Could Continue to Improve
Key Takeaway: Recent economic data has moved more in line with market expectations. That said, the trend in growth for the second half continues to look stronger than what was seen in the first half. Composite economic indicators of actual activity are improving and we are seeing reasons for confidence in a rebound in growth in the second half.
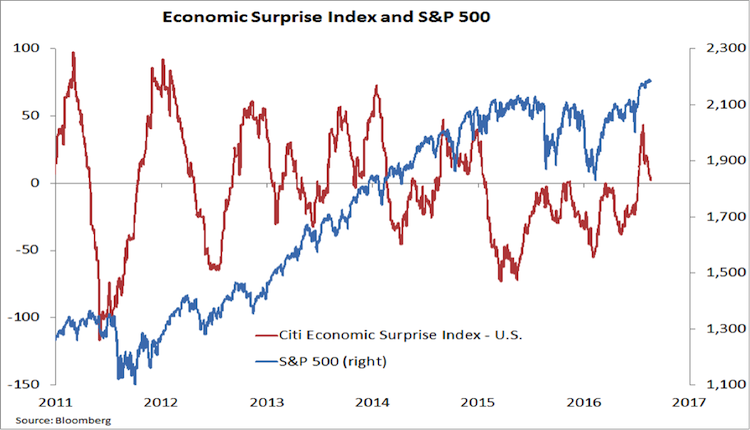
The upside surprises in economic data that began to emerge in early July have largely dissipated. The Economic Surprise index, which had moved meaningfully above zero for the first time in 18 months, has retreated back toward zero. The day-to-day and week-to-week volatility in this index is more a reflection of the difficultly in accurately forecasting monthly changes in specific economic variables more than it is a commentary on the overall health of the economy.
The protracted stay below zero that was seen from early 2015 through mid-2016. However, does suggest some relatively persistent weakness that forecasters unable to get ahead. That now appears to have run its course, and the current move back to zero in the economic surprise index is evidence of a near-term equilibrium between the forecasts and the data.
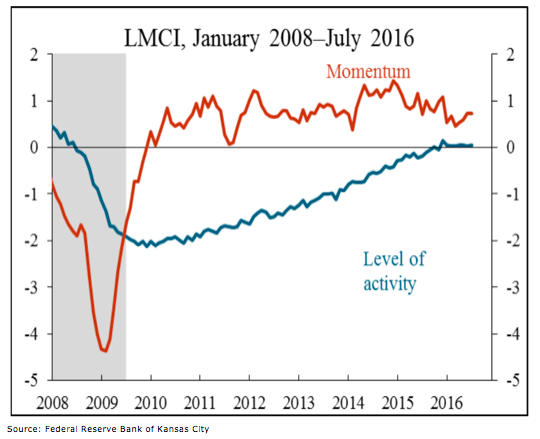
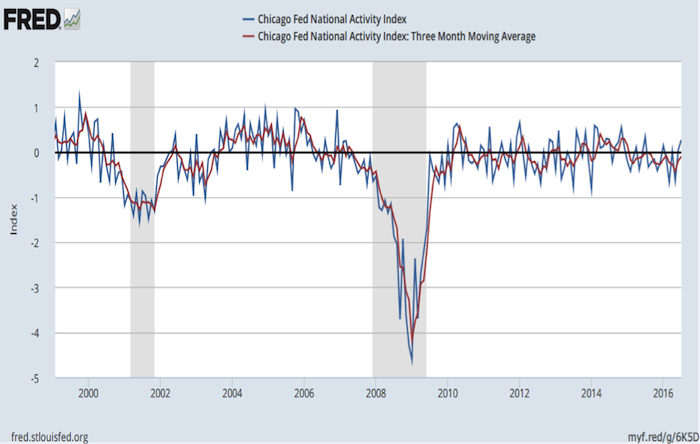
The actual data (as measured by composite indicators, not monthly changes in individual data series) continue to move in a positive direction. This is true for both the broad Chicago Fed National Activity Index (CFNAI) and the narrower Kansas City Fed Labor Market Conditions Index (LMCI).
Also read: Will Stocks Trip On Seasonal Weakness?
Both the LMCI and the CFNAI are composite indicators that have historically done a good job of catching the overall trend in actual economic activity. Both showed (consistent with the message from the economic surprise index) a distinct loss in momentum starting in late-2014/early-2015. Recent readings have been more encouraging. Upside momentum is being re-established in the labor market, with July representing the fourth consecutive increase in the momentum indicator. Market expectations are slowly catching up.
The CFNAI, which measures whether growth is above trend (positive values) or below trend (negative values), has moved to its highest level in a year, and the more stable three-month average is on the cusp of its first positive reading since January 2015.
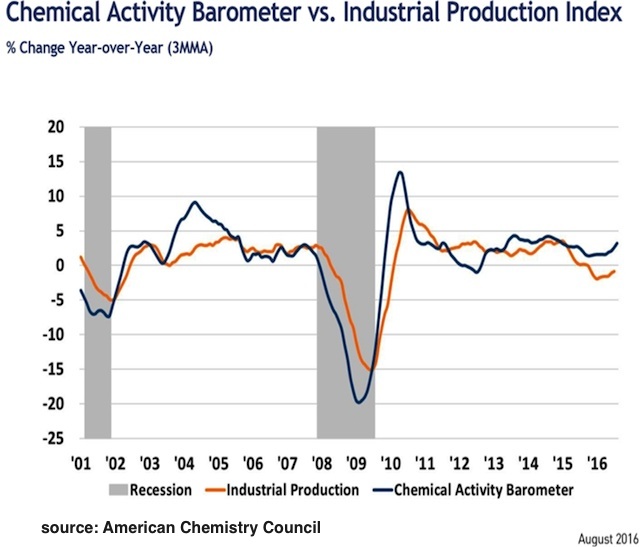
There is reason to be hopeful that the recently improved tone in the economic data could persist over the second half of 2016. Industrial production growth has turned higher, and the Chemical Activity Barometer, which tends to move ahead of overall production at important turning points, continues to climb.
One last note on the economy (and economic data). Over the past five quarters, inventory effects have subtracted an average 60 basis points of GDP growth per quarter. With production improving and CEO confidence (as measured by the Conference Board) rebounding, this persistent headwind could soon be a modest tailwind.
Thanks for reading.
Twitter: @WillieDelwiche
Any opinions expressed herein are solely those of the author, and do not in any way represent the views or opinions of any other person or entity.

 Flirting With Critical Support… Again")


