The Dow Jones Transportation Average (INDEXDJX:DJT) made new highs in March of 2017. This is typically a bullish development, but it has yet to see “follow-through” higher.
As well, there are 2 BIG reasons to keep an eye on the Transports here. And both have to do with historical precedent.
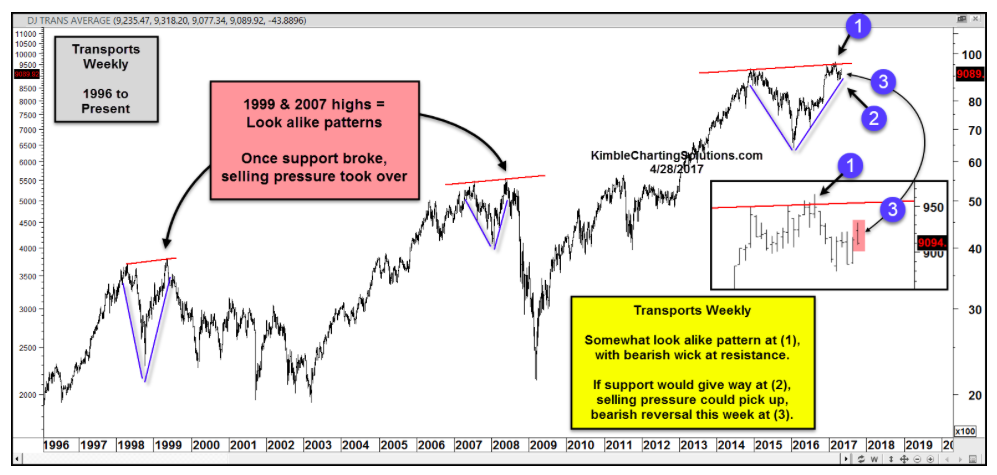
The chart below looks at the Dow Transports over the past 20+ years. As you can see, we have a “look alike” repeating pattern that may be occurring for the 3rd time. And the prior two lead to bearish downturns.
In 1999, the Transports made new highs but failed to see follow through… then it broke it’s steep uptrend line and fell into a bear market. In 2007, the Transports did the same thing.
Could this pattern be repeating itself yet again? The jury is out, but investors should take note. You can see the Transports made a new high earlier this year (point 1), but a reversal lower created a bearish wick. This lead to a pullback to test the steep uptrend line off the 2016 lows (point 2). And further concerns came just last week when the Transports reversed lower, forming a bearish reversal candle (point 3).
If this pattern repeats, it could mean “risk-off” for the broader market. So stay tuned!
Thanks for reading.
ALSO READ: Gold Miners ETF (GDX) At Critical Juncture
Twitter: @KimbleCharting
Any opinions expressed herein are solely those of the author, and do not in any way represent the views or opinions of any other person or entity.


