 After rising over 3,000 points from last November’s corrective lows, the Dow Jones Industrial Average (DJIA) is closing in on an important technical intersection. Two important technical observations: 1) The short-term and long-term trends are still in tact. 2) The Dow Jones is nearing major overhead technical resistance.
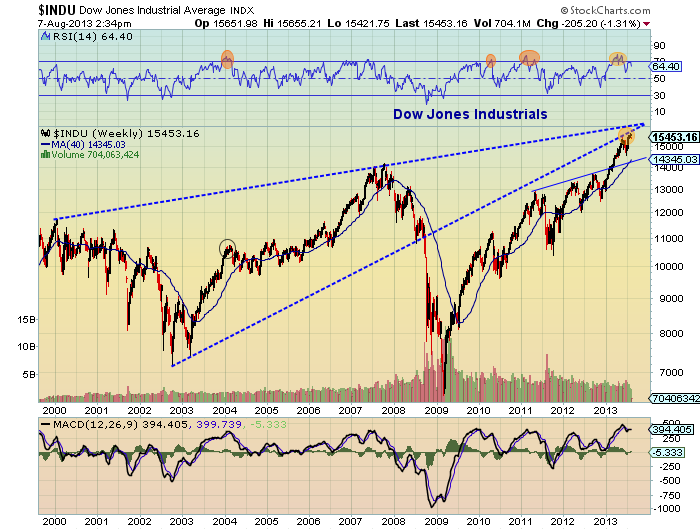
So what do investors make of this? Well, the bull case is pretty clear… but easier said than executed: Stops go just below the trend lines… and time frames matter (short-term trends vs long-term trends). That said, looking at the chart below, Dow Jones technical resistance is looming. The Dow Jones is already starting to stutter a bit and would likely find additional turbulence at the 16,000-16,500 level, should it extend towards that area over the near-term. Seatbelts please.
And although this sends a message of caution over the near-term, investors should also be aware of this resistance level for another possibility: a bullish phase transition. Although this would likely require a recharge from the previously mentioned resistance level, it is possible that we see the index power above this level over the next 6 months. And if that happens, we could see a massive breakout and strong capital flows that could push the index substantially higher.
Try not to anticipate. Let the price action guide you. And always remember to trade safe, trade disciplined.
Stay tuned for a shorter term chartology of the Dow Jones. Thanks for reading.
Dow Jones Technical Resistance – Long-Term Chart
Twitter: @andrewnyquist and @seeitmarket
No position in any of the mentioned securities at the time of publication.
Any opinions expressed herein are solely those of the author, and do not in any way represent the views or opinions of any other person or entity.


