The past year has seen a strong, persistent rally in the Dow Jones Industrial Average.
Could there be further upside in store… perhaps another monster rally? Time to look at the chart!
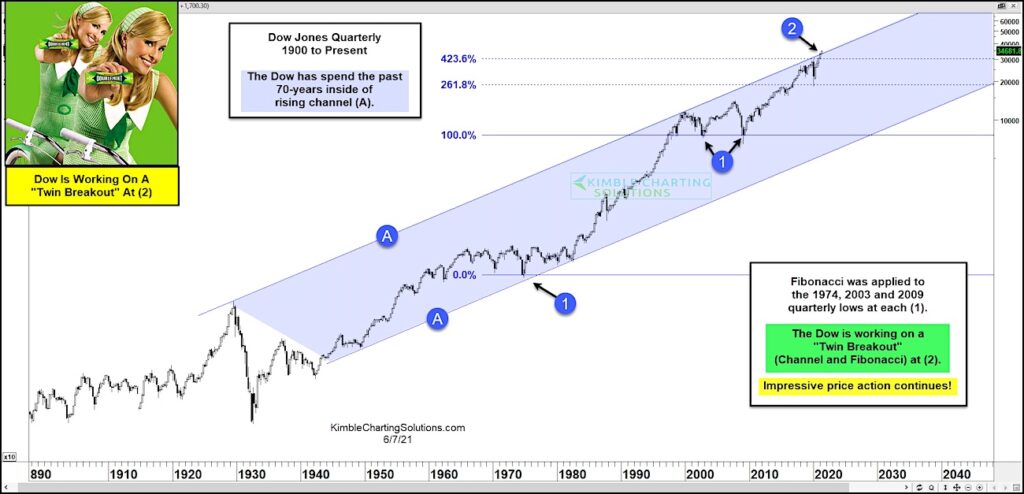
Today’s chart takes a very long-term view of the Dow Industrials. This “quarterly” chart illustrates the long-term rising bull market channel with blue shading marked by each (A). Taking our analysis one step further, we can apply Fibonacci to the 1974, 2003, and 2009 lows marked by each (1).
As you can see, the Dow Industrials broke out over the 100% Fibonacci extension before retesting it twice. It then book out over the 261.8% Fibonacci before testing it last year. And now the Dow Jones Industrial Average is trying to breakout over the 423.6% Fibonacci. This area also marks the upper end of the rising channel at (2), making it a “twin breakout” resistance area.
Will the Dow Industrials pause here or break out?
If the Dow Industrials can record a “Twin Breakout” at (2), another leg higher in the bull market may be in store. Stay tuned!
Dow Jones Industrial Average “Quarterly” Chart
Note that KimbleCharting is offering a 2 week Free trial to See It Market readers. Just send me an email to services@kimblechartingsolutions.com for details to get set up.
Twitter: @KimbleCharting
Any opinions expressed herein are solely those of the author, and do not in any way represent the views or opinions of any other person or entity.


