The Dow Jones Industrial Average is in the midst of a bounce off its March low and may be looking to retest its highs in the weeks ahead.
But this could be trickier than most rally retests.
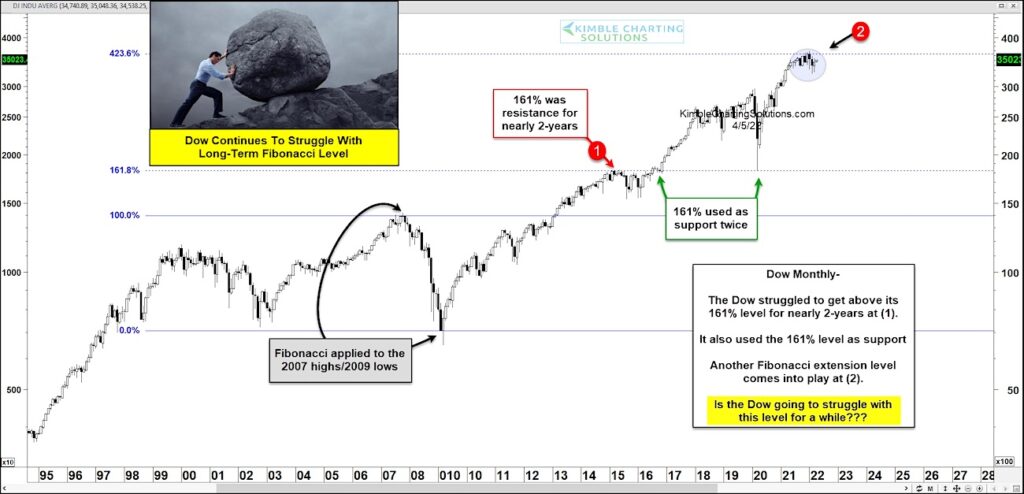
Why? Because the recent high failed right at the 423.6 Fibonacci extension price level (using 2007 high / 2009 low).
As you can see in today’s “monthly” chart of the Dow Industrials, it took nearly two years for this major stock market index to crack its 161.8% Fibonacci extension at (1). And even after doing so, and rallying mightily, it came back to retest the area as support years later!
These Fibs matter.
Once again, the Dow Jones Industrial Average is testing a major Fibonacci level at (2). Will this Fib level continue to cause the Dow to struggle? Or will an uber bullish breakout take place? Stay tuned!
Dow Jones Industrial Average “monthly” Chart
Note that KimbleCharting is offering a 2 week Free trial to See It Market readers. Just send me an email to services@kimblechartingsolutions.com for details to get set up.
Twitter: @KimbleCharting
Any opinions expressed herein are solely those of the author, and do not in any way represent the views or opinions of any other person or entity.


