The market had a relatively quiet day as investors look to the Thanksgiving holiday.
Stocks did end lower on Monday, with the QQQs declining 1.1%. DIA lost 0.06% today.
As seen in the chart below, starting from October 11, 2022, the Dow Jones (represented by DIA) outperformed the other key US Indices.
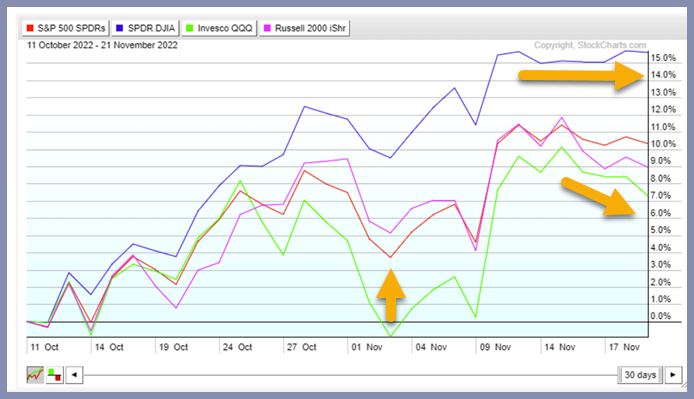
In comparison to the tech heavy QQQs, which are down -29.71% year to date, DIA is only down -7.8%.
Although trading volumes are often lower during a holiday-shortened week, traders should remain vigilant.
Our risk gauges continue to flash caution. Consumer Staples led on Monday with a gain of 1.1%, while Utilities have gained almost 3% over the last five trading days despite a decline in risk-on sectors.
Traders should monitor volatility closely and the performance of each US index because they offer a glimpse of where things could be heading by year’s end.
DIA is down modestly from recent highs while decisively outperforming small caps and technology. DIA is close to taking out the previous highs of mid-August.
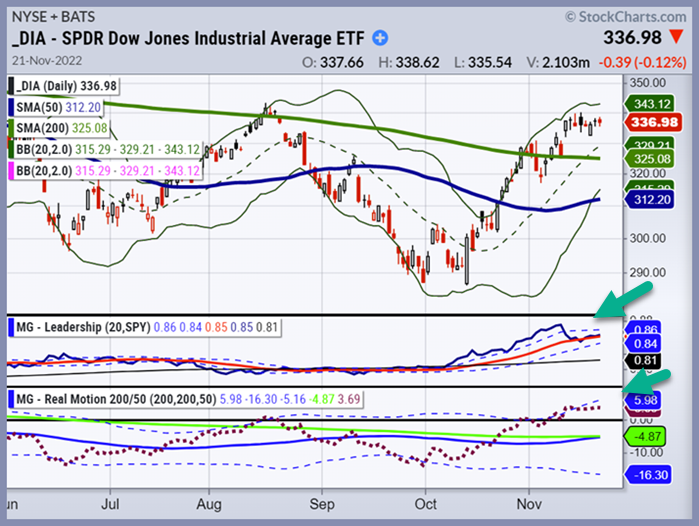
DIA shows leadership in the Triple Play Indicator and strong momentum in the Real Motion Indicator, as shown by the green arrows above.
The Trend Strength Indicator (TSI) score for DIA is positive at 3.38, which is exceptionally high, suggesting that the current trend is robust and has more longevity.
DIA’s TSI is positive and the strongest of the four equity US benchmarks.
DIA also crossed the 200-week moving average in early November and is now trading sideways, consolidating recent moves.
In an inflationary climate, investing in firms with strong cash flow, pricing power, and dividends becomes more appealing and many of these companies are in the Dow Jones.
Using our proprietary trading indicators, such as Real Motion and Leadership you will be able to trade effectively, recognize trend strength and pinpoint trend leadership for effective trading in any market condition.
Stock Market Trading ETFs Analysis & Summary:
S&P 500 (SPY) 392 support and 397 resistance
Russell 2000 (IWM) 179 support and 185 resistance
Dow (DIA) 334 support and 340 resistance
Nasdaq (QQQ) 278 support and 286 resistance
KRE (Regional Banks) 60 support and 66 resistance
SMH (Semiconductors) 210 support and 219 resistance
IYT (Transportation) 222 support and 228 resistance
IBB (Biotechnology) 130 support and 136 resistance
XRT (Retail) 62 support and 67 resistance
This article was contributed to by Keith Schneider and Wade Dawson.
Twitter: @marketminute
The author may have a position in mentioned securities at the time of publication. Any opinions expressed herein are solely those of the author and do not represent the views or opinions of any other person or entity.

: Showing Some Signs of Emerging Strength")
