Similar to other major U.S. stock market indexes, the Dow Jones Industrial Average (DJIA) has been moving higher amidst a considerable amount of market chop. As we near the end of May and the end of a seasonally favored market period, I thought it would be good to update readers on the current technical state of the Dow Jones Industrial Average.
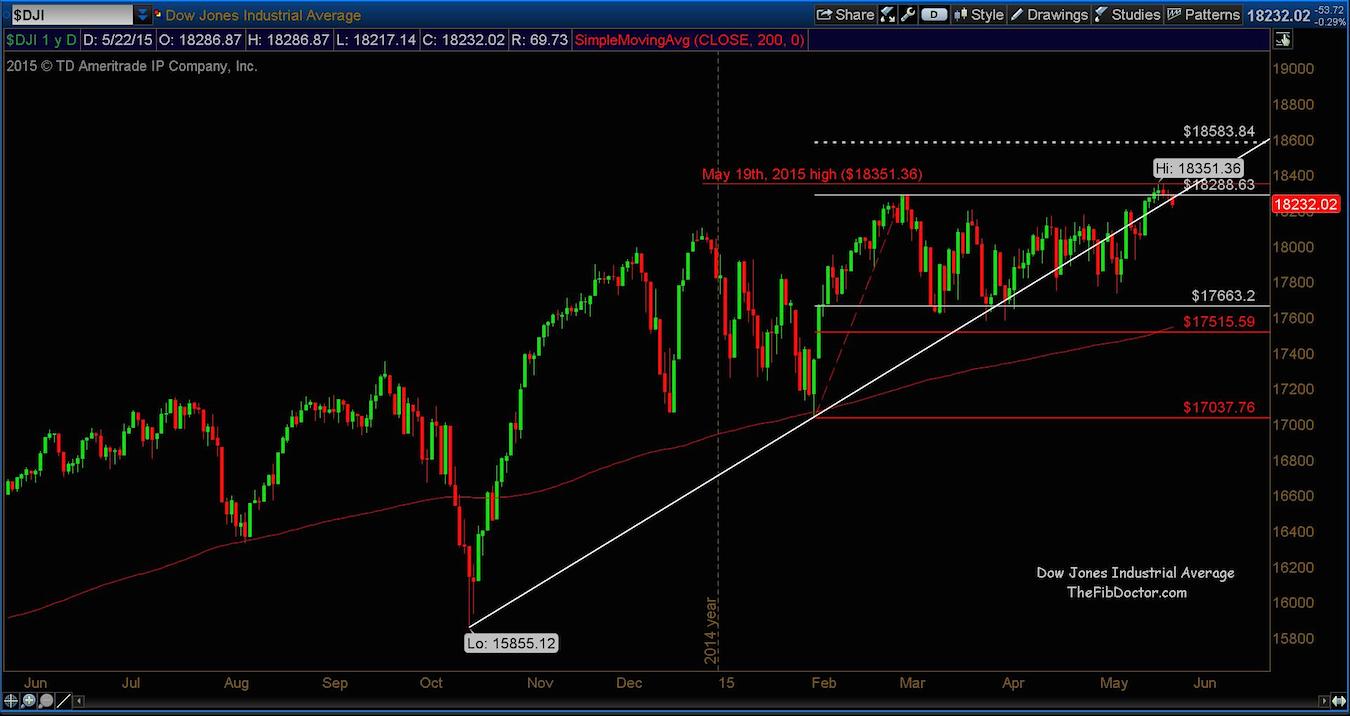
On October 15th, 2014 the Dow Jones Industrials (DJIA) made a low of 15855.12. Using old school trend line charting, we see the following:
- The uptrend was tested and held on February 2nd, 2015.
- The uptrend was tested and held several times until April 30th, 2015.
- In the next 17 trading sessions, price closed below the uptrend line 8 times but never violated or even pulled back to Fibonacci support levels.
- The current projected target is 18583.84.
- Key support levels reside at 17663.2 and 17515.59.
Currently, the high of May 19th, 2015 of 18351.36 is a level that I’ll be watching closely for a clean break and close above. Otherwise, traders would be wise to watch their support.
Dow Jones Industrial Average (DJIA) Chart
Thanks for reading and remember to always use a stop!
Twitter: @TheFibDoctor
No position in any of the mentioned securities at the time of publication. Any opinions expressed herein are solely those of the author, and do not in any way represent the views or opinions of any other person or entity.


