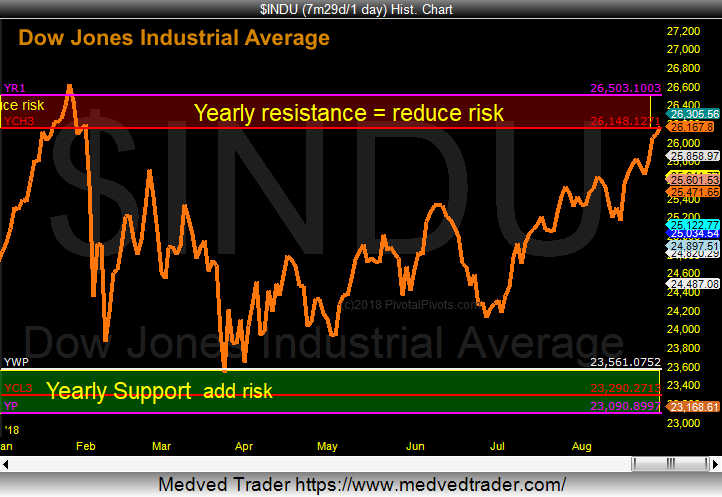
The Dow Jones Industrial Average (DJIA, INDU) is back near the high of the year at the Yearly R1 Pivot Points.
Last February, the Dow Jones Industrials fell 3,000 pts. after testing the Yr1 Pivots in January (see chart below).
With September being the worst month of the year since 1950 (per Stock Traders Almanac), this may be a good spot to start reducing or hedging equities risk.
The biggest reversals during the year seem to happen at the Yearly Pivot Points.
At PivotalPivots, I like buying good companies when they go on sale (GOOGL, NKTR, TWTR, CPB, CGC, KO, PEP, MNST, GLW, etc). The Yearly pivots shows us exactly where to add and reduce our risk.
To learn more about yearly pivot points, please check out my “Using multiple pivot points for trading opportunities” webinar.
Twitter: @Pivotal_Pivots
The author may have a position in mentioned securities at the time of publication. Any opinions expressed herein are solely those of the author, and do not in any way represent the views or opinions of any other person or entity.

: Showing Some Signs of Emerging Strength")
