After a strong Q4 2023, the S&P 500 started 2024 with a whimper! Is this the beginning of a further deterioration for the Nasdaq 100 and other growth stocks, or was that just a temporary reset before the great bull market continues?
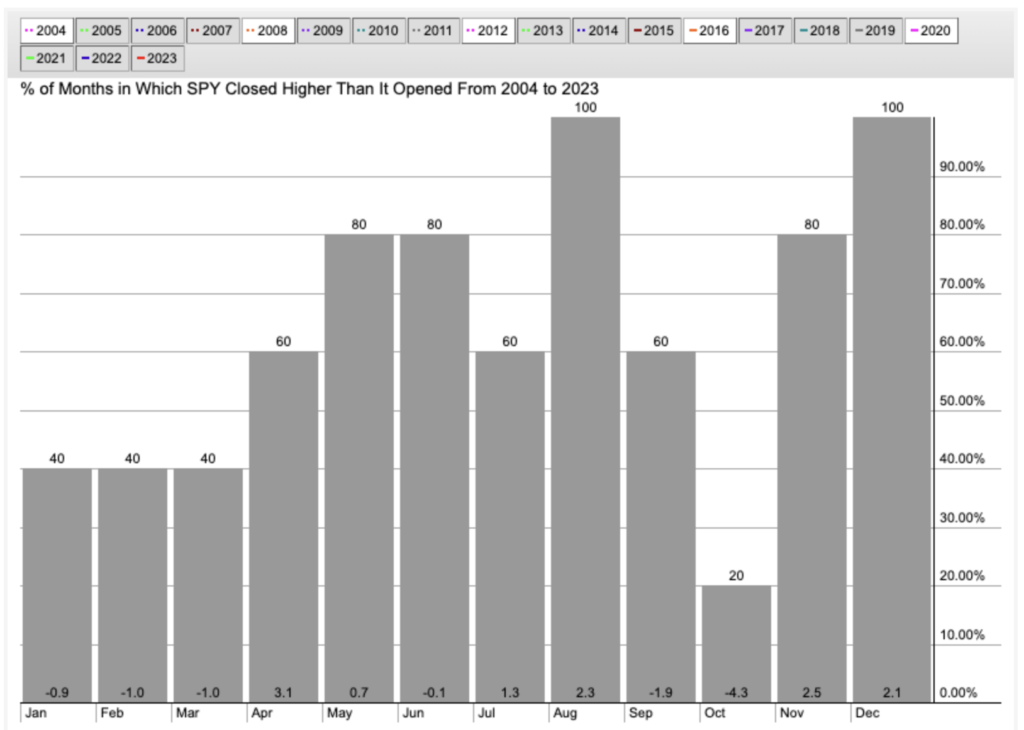
When you look at previous election years, you’ll see that the first quarter usually is quite underwhelming. In fact, January through March is the weakest three-month series of all! While the market often recovers with a strong Q2, the first three months tend to have negative returns going into a March low.
In today’s video, we’ll show you what usually happens in the first quarter of an election year, why a March low could indeed be in the cards, and which breadth and sentiment charts we’re watching to manage risk in Q1. See 2 key charts below today’s video.
What do the seasonal headwinds in the first quarter mean relative to the price strength we’ve observed in recent months?
What could a March low mean for medium-term and long-term investors who missed out on key gains in 2023?
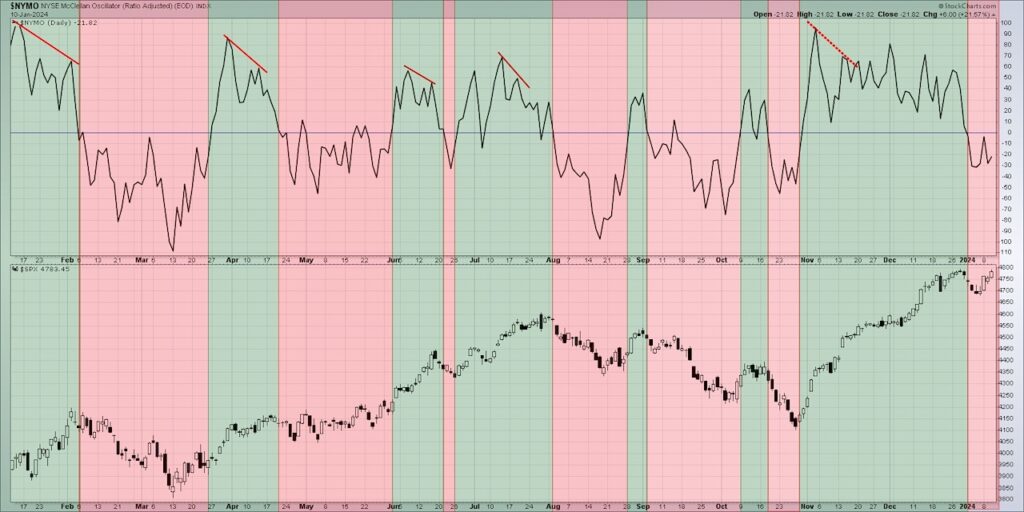
Which breadth and sentiment indicators can be most helpful in identifying a market that has gone full “risk off” with greater downside potential?
VIDEO? S&P 500 Seasonal Weakness?
Twitter: @DKellerCMT
The author may have positions in mentioned securities at the time of publication. Any opinions expressed herein are solely those of the author, and do not in any way represent the views or opinions of any other person or entity.


