Investors are most comfortable being long and strong stocks when “risk on” indicators are flashing green.
What that means in simple terms is that the stock market is most bullish when investors take on more risk by buying small cap stocks, tech stocks, growth stocks, junk bonds (high yield bonds), etc…
Today we take a quick and simple look at junk bonds via the SPDR ETF (JNK). We’ll look at the charts below, but the quick and dirty is that Junk Bonds (JNK) don’t look so good right now. And this could be an indication that it’s time to be risk averse.
Note that the following MarketSmith charts are built with Investors Business Daily’s product suite.
I am an Investors Business Daily (IBD) partner and promote the use of their products. The entire platform offers a good mix of tools, education, and technical and fundamental data.
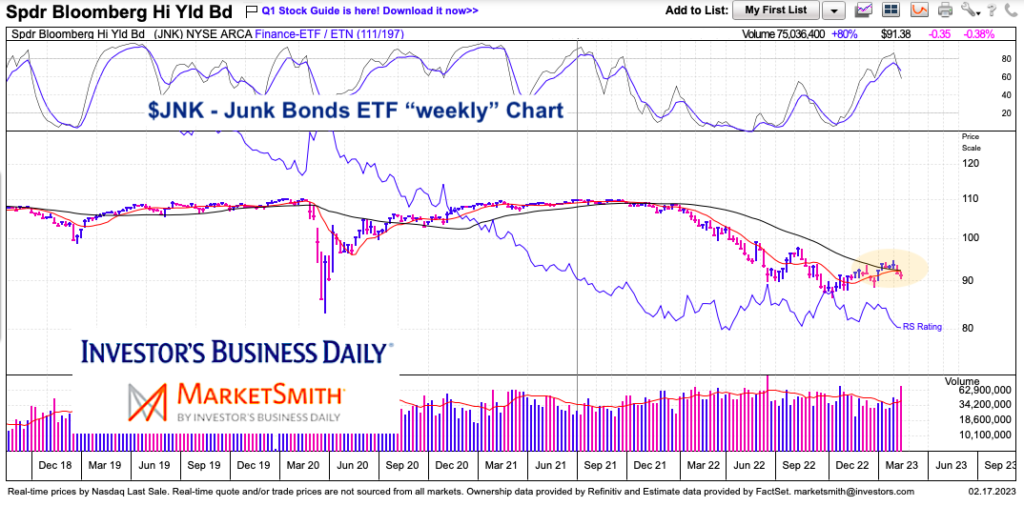
$JNK Junk Bonds ETF “weekly” Chart
The “weekly” chart of JNK allows us to zoom out and see the entire picture. Not so good. As you can see, the overhead window pane shows momentum crossing over to the downside. As well, price has fallen below the 10 and 40 week moving averages. Bulls need a quick recovery or the market will likely move sideways or lower.
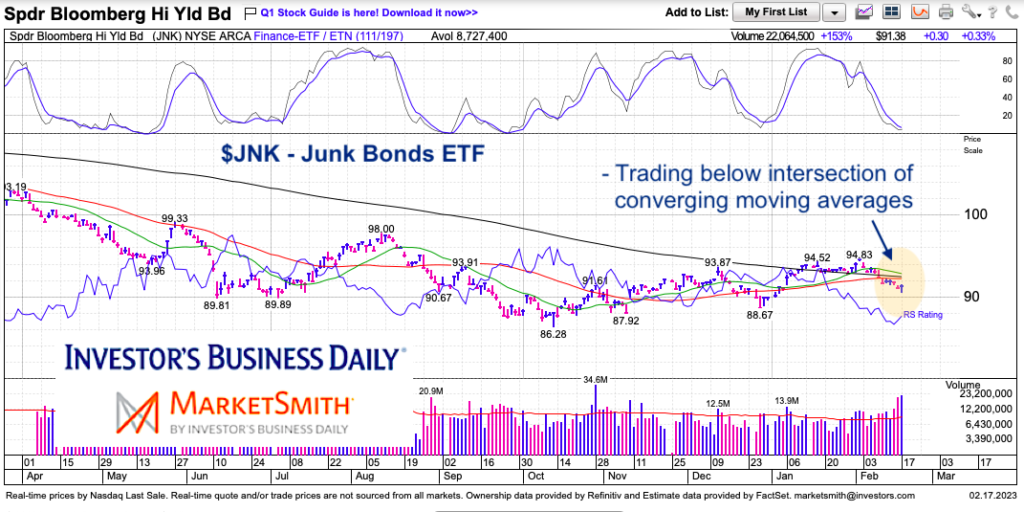
$JNK Junk Bonds ETF “daily” Chart
The “daily” chart is more of the same. Price is trading below the intersection of all 3 moving averages. Caution advised.
Twitter: @andrewnyquist
The author may have a position in mentioned securities at the time of publication. Any opinions expressed herein are solely those of the author, and do not in any way represent the views or opinions of any other person or entity.


