What we know for sure, is that the demand side of the U.S. Economy, as seen through the lens of the transportation sector, is holding up.
IYT AI generated here, is the ETF for things that move and carry people and cargo via ship, plane, freight, trucks, and cruise lines.
And our pilot is smiling.
The Global JETS ETF has been bottoming and along with IYT has cleared the 23-month moving average.
Note, the month is not quite over, so we will give it a few more days.
However, at this rate, with GDP and PCE on tap, we expect that should IYT and JETS maintain their strength, the bulls will come back and buy.
How does increasing demand impact inflation?
That never ceases to be a factor as the general macro themes.
But for now, IYT gives the bulls hops.
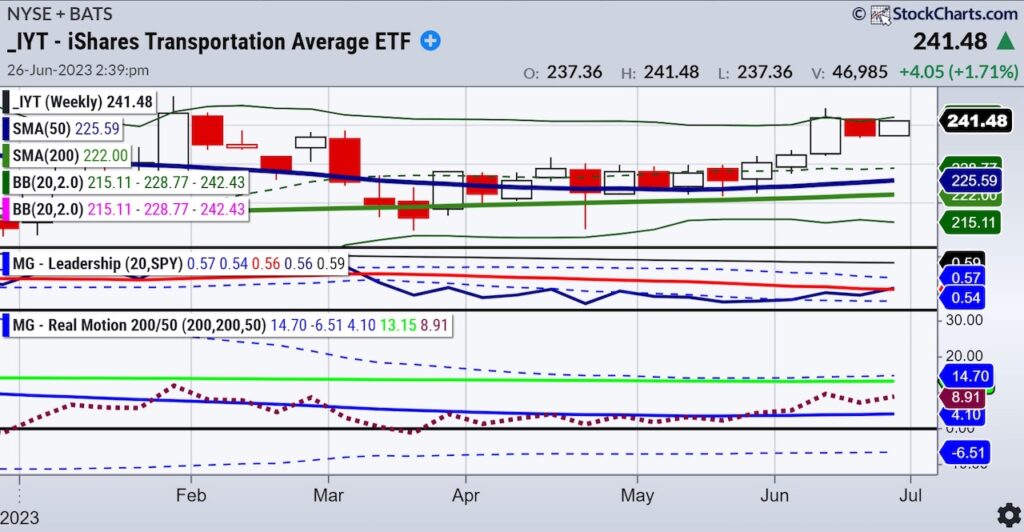
The weekly chart shows 2 inside weeks. That means that the subsequent trading range last week and so far this week, are inside the trading range of 2 weeks ago.
Which means pause.
But a pause near the recent highs and not too far from January highs.
Furthermore, on our Leadership indicator and ACP plug in, IYT is beginning to outperform the SPY.
Real Motion or our Momentum indicator shows rising momentum.
Nonetheless, the other takeaway is that there is a bearish diversion in momentum to price.
While the price is above both the 50 and 200-Week Moving Averages, and the 50 week sits above the 200 in stack…
The momentum indicator is above the 50-WMA but below the 200-WMA.
Plus, we like to see the stack line up with the price MAs.
In other words, we like to see the 50-WMA above the 200-WMA in both scenarios.
Hence, IYT needs to hold above 238 this week as we end June.
And if it does, assume another leg higher.
Of course, we need Granny Retail and Granddad Russell 200 to stay in the game.
Otherwise, we might see 2389 break this week, and IYT take a dive closer to 230.
Stock Market ETFs Trading Analysis & Summary:
S&P 500 (SPY) Slow start 430-437 tight range
Russell 2000 (IWM) 180 held-can we get back over 183?
Dow (DIA) 33,500 the 23-month MA now back above
Nasdaq (QQQ) 360 support and an inside week
Regional banks (KRE) Back over 40-so now we need a new move over 42
Semiconductors (SMH) 150 to clear
Transportation (IYT) Last week in June and 238 area the 23-month moving average key
Biotechnology (IBB) 121-135 range
Retail (XRT) 62 support and if clears back over 63, optimism returns-under 60 not so much
Twitter: @marketminute
The author may have a position in mentioned securities at the time of publication. Any opinions expressed herein are solely those of the author and do not represent the views or opinions of any other person or entity.

: Showing Some Signs of Emerging Strength")
