The following research was contributed to by Christine Short, VP of Research at Wall Street Horizon.
- The second-quarter earnings period featured an impressive EPS beat rate, but guidance was less optimistic
- We found that dividend change announcement trends are also underscoring a toned-down outlook from global executives
- Traders must possess high-quality data amid shifting macro and firm-specific dynamics
Investors can catch their bearings now that an action-packed Q2 earnings season is in the rearview mirror. The landscape began with a tame US Dollar Index, steady interest rates, and an S&P 500 that was in rally mode off its mid-March low.
JPMorgan Chase (JPM) kicked things off with solid results – the bank topped Wall Street consensus estimates and increased net interest income guidance for the year. Shares rallied, and the broader sector rose into late July. That was also about when the Dow Jones Industrial Average rose for 13 consecutive sessions. Times were good ahead of mega-cap-tech earnings that took place in the middle of the season.
AI Hype, Retail Reality
The newly crowned “Magnificent Seven” also issued respectable numbers, but eyes were not so much on the Apples or Microsofts of the world, but rather Nvidia (NVDA) – a late-season reporter. So, investors had to bide their time ahead of the chipmaker’s second-quarter numbers. Stocks peaked on July 31, and jitters only rose amid a flurry of volatile retail stock-price reactions. Among the many themes of earnings season was a pronounced uptick in shrink among both high-end and low-end consumer firms.
Nvidia’s results then finally hit the tape. The world’s fifth biggest publicly traded company gapped higher following yet another stunning bottom-line beat and guidance hike. The kicker was a new $25 billion share buyback program – a positive signal from the management team. Unlike the price spike seen after the previous quarterly report, the rally to above $500 (up from $150 at the start of the year) didn’t hold. While NVDA notched a fresh all-time closing high in late August, the stock has yet to climb above the earnings-reaction peak.
Strong Earnings, Weak Reactions
NVDA was a bit of a microcosm for the Q2 reporting period. The aggregate bottom-line beat rate, as reported by FactSet, was high at 79% – above the 5-year average of just 77%. The problem, however, was that S&P 500 companies that topped estimates saw their stock price fall 0.3%, compared to the usual trend of a 1% average price change. Companies that missed EPS forecasts endured a 2.6% decline, on average, which was also worse than the historical norm, per FactSet.
Rates, the Dollar, and Oil – Oh My!
Looking ahead to the Q3 earnings season, nearly a quarter of SPX firms have posted guidance, and 74 companies issued reduced outlooks while 42 raised their earnings forecasts. That is not a positive ratio, but it’s not surprising.
Macro conditions have turned cloudier from two months ago when all eyes were focused on JPM and all ears were tuned to Jamie Dimon’s words. Interest rates are up about half a percentage point across the belly of the curve all the way to the long bond. The US Dollar Index has surged from under 100 to 105. Oil prices also took off – WTI has risen from the mid-$60s to above $90 as Brent trades a stone’s throw from $100. Each of those three factors could weigh on corporate profits over the coming quarters.
Zooming In
But what about at the company level? Aside from guidance, are other insights able to be garnered from all that the earnings season offered up to investors? Well, we found one.
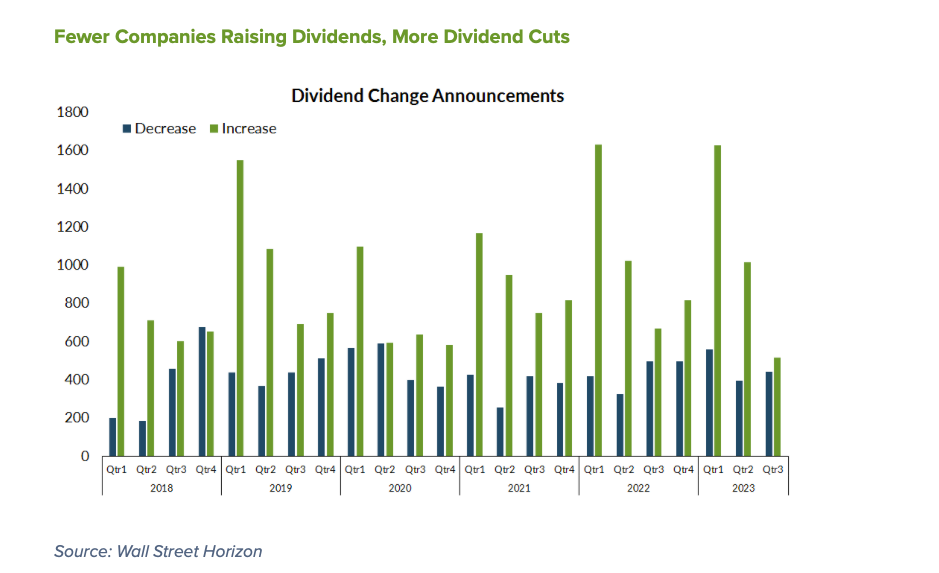
Wall Street Horizon’s data team noticed a less-than-sanguine signal via dividend change announcements. So far this quarter, more companies are decreasing their dividend versus increasing their payout compared to previous quarters. The gap, illustrated below, is the narrowest since Q2 2020 (and we all know what was happening then).
Fewer Companies Raising Dividends, More Dividend Cuts
Shades of 2018?
Particularly thought-provoking is that the number of net-increasers is almost on par with what was seen in Q4 2018. Maybe you have to shake some cobwebs loose, but that was also a period of Fed tightening. The last few months of 2018 also featured a sharply falling stock market that bottomed out on Christmas Eve. Overall, the dividend announcement trend mirrors what we’ve seen in reverse stock splits, both ghoulish signals.
Getting Robust Data on Your Side
Clearly the tone on Wall Street is cautious amid rising risks to profitability caused by macro factors. It will make earnings calls all the more interesting next month and after. For now, traders and portfolio managers must keep close tabs on corporate body language and be sure to have the best data strategies to make decisions.
It’s more important than ever to recognize trends amid increasing volume and diversity of corporate event information due to the digital revolution. Effectively using corporate event data empowers researchers and money managers alike to harness new indicators, such as our proprietary Late Earnings Report Index (LERI). Find out more about what factors move stocks and how to manage risk in our updated white paper Exploring Corporate Event Data & Volatility.
The Bottom Line
Q2 earnings season is in the books, and investors face a mixed landscape. The EPS beat rate was good, but stock prices wavered over the period. Looking ahead to the balance of 2023, macro factors like rising interest rates, a stronger US dollar, and surging oil prices pose potential challenges to corporate profits.
Under the surface, a noteworthy trend has emerged in dividend change announcements, with more companies reducing their dividends compared to Q2. This cautious tone on Wall Street suggests that investors should closely monitor corporate behavior and leverage high-quality data, such as the LERI, to navigate an increasingly complex market environment.
¹ https://advantage.factset.com
For more information on the data sourced in this report, please email: info@wallstreethorizon.com
Wall Street Horizon provides institutional traders and investors with the most accurate and comprehensive forward-looking event data. Covering 9,000 companies worldwide, we offer more than 40 corporate event types via a range of delivery options from machine-readable files to API solutions to streaming feeds. By keeping clients apprised of critical market-moving events and event revisions, our data empowers financial professionals to take advantage of or avoid the ensuing volatility.

Christine Short, VP of Research at Wall Street Horizon, is focused on publishing research on Wall Street Horizon event data covering 9,000 global equities in the marketplace. Over the past 15 years in the financial data industry, her research has been widely featured in financial news outlets including regular appearances on networks such as CNBC and Fox to talk corporate earnings and the economy.
Twitter: @ChristineLShort
The author may hold positions in mentioned securities. Any opinions expressed herein are solely those of the author, and do not in any way represent the views or opinions of any other person or entity.


