Disappointing economic data combined with ongoing geopolitical developments were largely responsible for the weakness in the equity markets last week. When all was said and done, the S&P 500 Index (INDEXSP:.INX) was lower by 1.2% (closing on its lows for the week).
Retail sales declined for the second month in a row in March. This prompted the Federal Reserve of Atlanta to downgrade first quarter GDP growth expectations to just 0.5%. The latest inflation reports tended to confirm the weakness in the economy with the Consumer Price Index (CPI) down 0.1%. The CPI print last month was the first negative number since 2010.
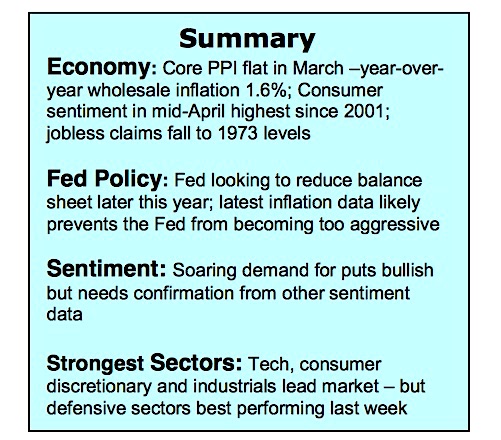
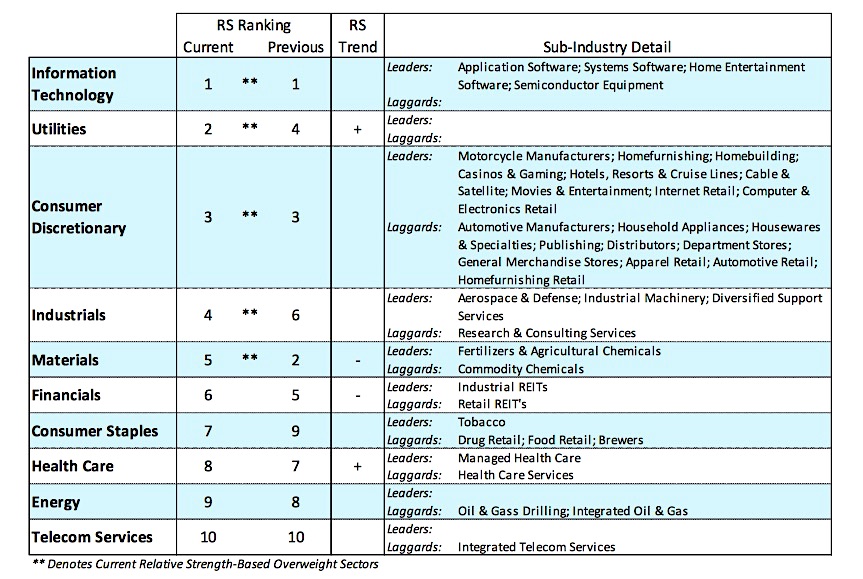
The latest economic numbers caused the yield on the benchmark 10- year Treasury note to drop to 2.30%, the lowest level since November. The consolidation/correction phase now enters the seventh week. Despite the March/April weakness, the S&P 500 Index is only 3.0% from the record highs. The fact that the pullback has been shallow is likely due to the decline in interest rates that leaves investors with few options, and expectations that corporate profits grew 10% in the first quarter. The best performing sectors last week were defensive areas including utilities, REITs and consumer staples. A continued movement toward defensive sectors and away from those most closely aligned to the economy would argue that the correction has not yet run its course.
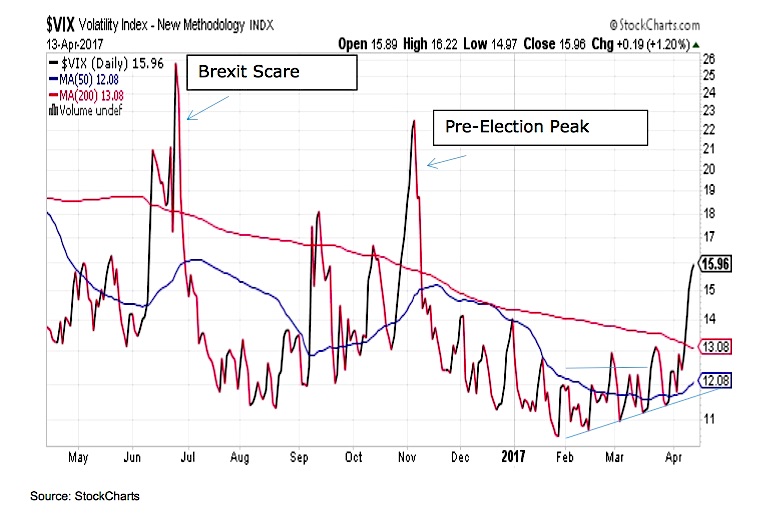
The technical indicators also point to the likelihood that the consolidation/correction phase will continue as we move deeper into the second quarter. The Volatility Index (INDEXCBOE:VIX) has moved higher while the short-term trend of the stock market has decisively turned down with popular averages breaking below their 50-day moving averages last week. Breadth indicators have deteriorated with the percentage of S&P 500 industry groups in uptrends falling to 66% from 82% in February. The bullish momentum since the November election expired in early March and now is a short-term drag on stocks. Despite the weakness, stocks are not yet considered oversold. Currently 67% of NYSE stocks are trading above their 10-week moving average. We would need to see this fall below 50% before suggesting the decline is overdone and stocks are positioned for a sustained advance.
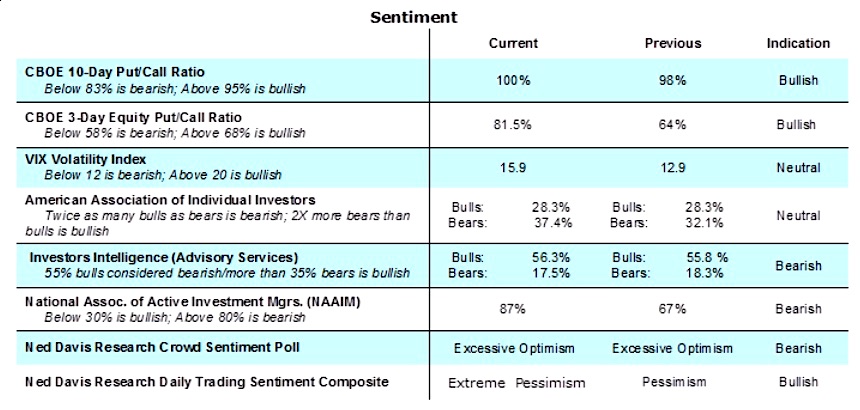
Sentiment indicators, which are often a reliable indicator of a potential trend change, remain mixed. The surge in demand for put options last week is an early indication that investor pessimism is gaining a stronger foothold. Unfortunately, the pessimism is not yet universal or widespread as seen in the uptick in bulls among Wall Street letter writers last week and the jump in the allocation to stocks (67% to 87%) found in the latest report from the National Association of Active Investment Managers (NAAIM). To argue that the current weakness in stocks has run its course we would need witness the bullish advisors falling below 50% and the NAAIM professionals drop their allocation to stocks below 60%. The bottom line is the heavy demand for puts last week suggests we may be approaching a market low but we would need to see pessimism become more widespread to suggest a sustainable rally is very near.
Thanks for reading.
ALSO READ: S&P 500 Weekly Outlook: The VIX Awakens
Twitter: @WillieDelwiche
Any opinions expressed herein are solely those of the author, and do not in any way represent the views or opinions of any other person or entity.
")


