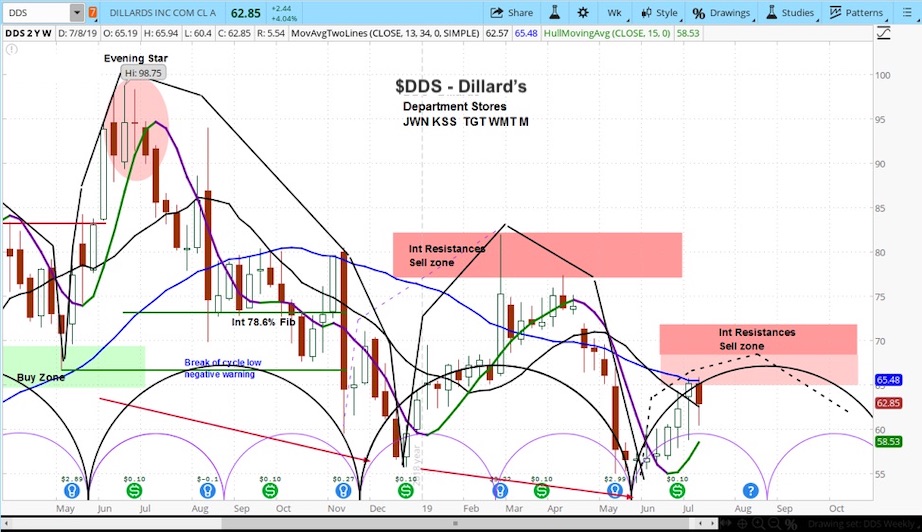
Dillard’s (NYSE: DDS) Stock Weekly Chart
Dillard’s (DDS) rose 4% on Thursday, after Wedbush upgraded the department store.
We think this is wrong. The stock bumped against resistance today and has an ugly technical chart.
Wedbush stock analyst Jen Redding changed her analysis on DDS from Underperform to Neutral. She based her decision on improved search trends, fewer discounts, as well as increased insider buying. She raised her price target to $62 from $54.
Our analysis is based on the market cycles for Dillard’s stock – DDS.
While the stock was in a clear rising phase of its current cycle, we believe it may already be showing signs of stalling. On Thursday, the stock again hit our resistance zone between $66 and $71 and then pulled back.
DDS has been trending lower over time. Since peaking in the middle of last year, it has broken down. Its previous two market cycles were negatively configured, showing lower highs and then falling below the low from which it started the cycle.
We believe this may occur again, and as such our forecast for the coming months is for minor upside, then another trip to new lows.
For more from Slim, or to learn about cycle analysis, check out the askSlim Market Week show every Friday on our YouTube channel.
Twitter: @askslim
Any opinions expressed herein are solely those of the author, and do not in any way represent the views or opinions of any other person or entity.


