While the Technology and Consumer Discretionary sectors receive all of the attention, there are a number of positive divergences between price and momentum on the relative charts of the industries within the Materials sector.
Today we’ll take a top down look at the Materials Sector, highlighting strength at the Industry level.
A Closer Look at the Materials Sector
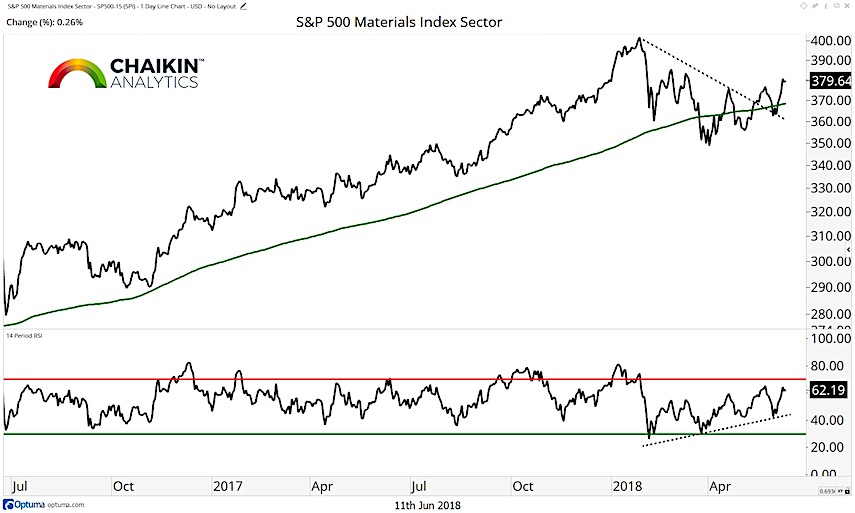
S&P 500 Materials Index (Absolute)
The S&P 500 Materials Index is beginning to move up and out of the consolidation that has marked trading since making a high in January (similar to the S&P 500). The index is trading above the rising 200-day moving average and the RSI is beginning to shift to bullish ranges.
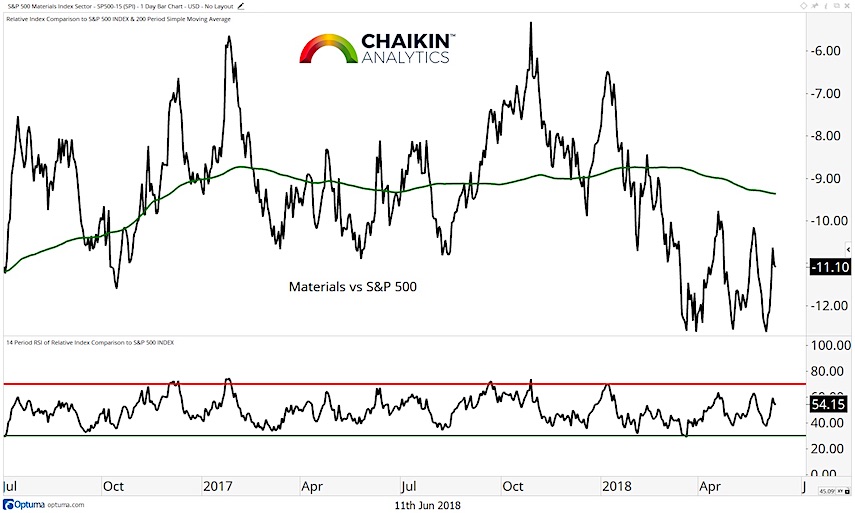
Materials Relative to the S&P 500
On a relative basis, the Materials Index is below the declining 200-day moving average but a recent test of support was met with a bullish divergence between price and the RSI. This opens the door to a test of the 200-day moving average in the near-term.
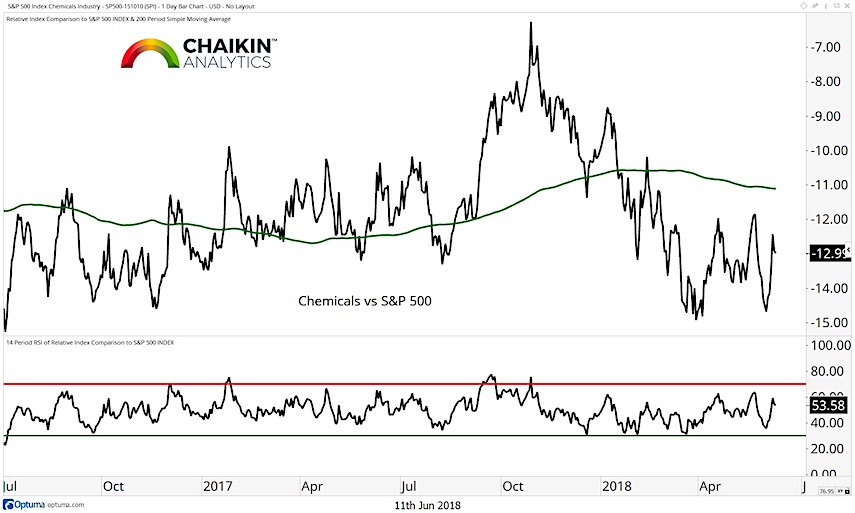
Chemicals Relative to the S&P 500
The Chemicals Index (relative to the S&P 500) has tested and held support recently and also registered a positive divergence between price and the RSI. This dynamic creates the potential for the ratio to revisit the 200-day moving average.
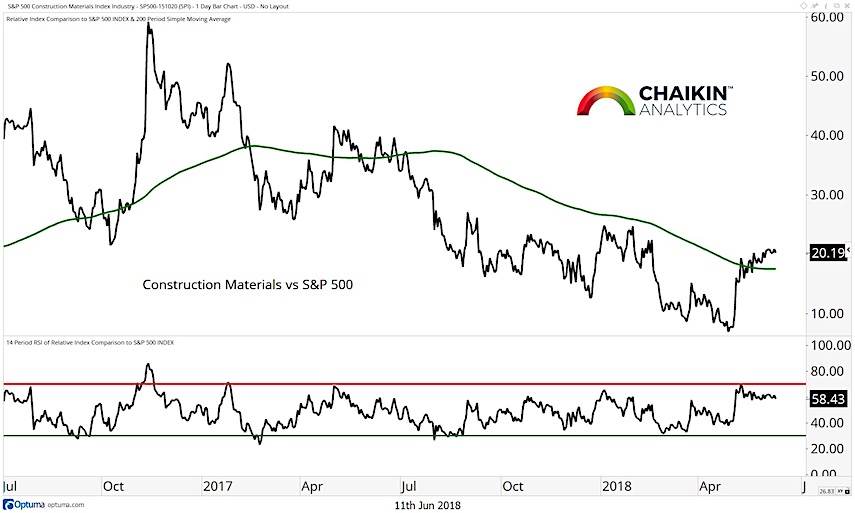
Construction Materials Relative to the S&P 500
The Construction Materials Index has moved up through the 200-day moving average which is shifting from declining to flat. The RSI has moved into bullish ranges after a positive divergence with price during the most recent low for the ratio.
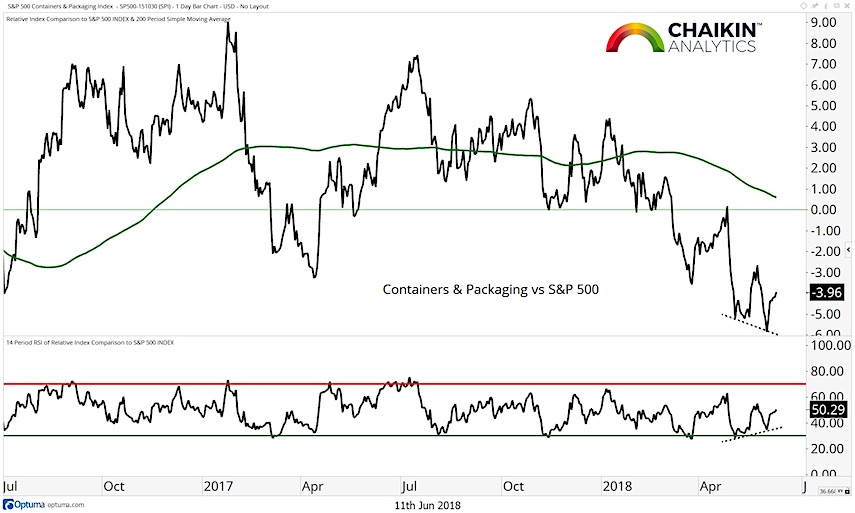
Containers & Packaging Relative to the S&P 500
The Containers and Packaging Index is in a downtrend, below the falling 200-day moving average. However, the stage is set for a potential countertrend rally as there is a positive divergence between price and momentum in place.
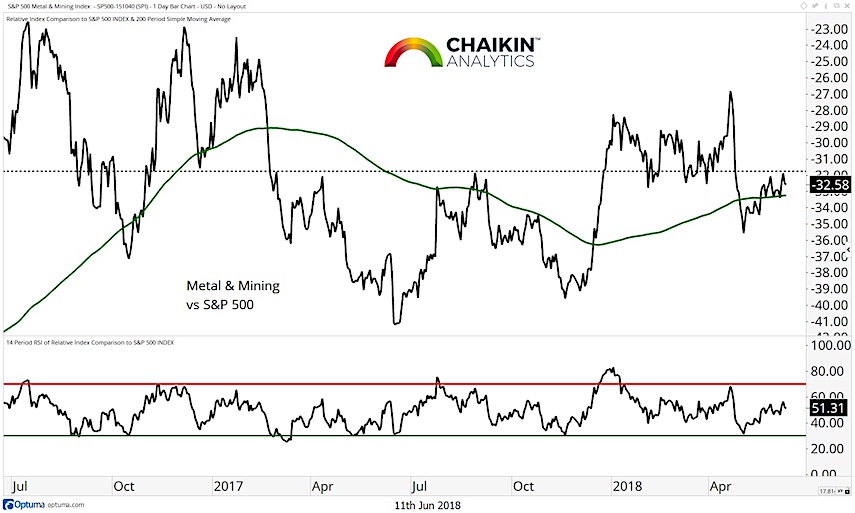
Metal & Mining Relative to the S&P 500
The Metal & Mining Index has been trading flat for two years relative to the S&P 500 and is currently close to the middle of the trading range. The RSI has marked a series of lower highs and is also in the middle of the range. The group is decidedly neutral.
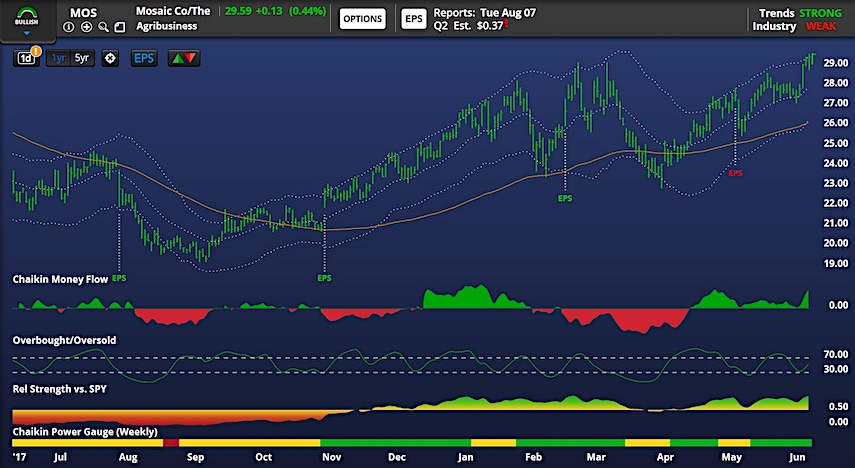
Based on this work, we like MOS on the long side. MOS has a Bullish Chaikin Power Gauge rating and has been leading the SPY since last November. The stock has registered a bullish Chaikin Money Flow reading as it trades near its 52-week high and above the rising lone-term trend line. Our Overbought/Oversold Indicator is currently in the middle of the range. Above the $27 level, probability favors a move to $36 for MOS.
You can gain more insights into our methodology and stock picking over at Chaikin Analytics. Thanks for reading.
Twitter: @DanRusso_CMT
Author may have a position in mentioned securities at the time of publication. Any opinions expressed herein are solely those of the author, and do not in any way represent the views or opinions of any other person or entity.

: Showing Some Signs of Emerging Strength")
