Much has been written about rising interests and the effect on the economy and financial markets.
Is inflation coming? How will the economy handle higher interest rates? Will the stock market correct? Etc…
All are valid questions but today we simply look at $TLT 20+ Year Treasury Bonds ETF (inverse relationship to rates) to try to determine the next move. A late-week reversal has bond bulls hoping that a bounce is underway. If so, that means interest rates may be nearing a “chill” period.
To be fair, the financial markets are a bit rattled by the bond market, so it’s time to look at the charts.
Note that the following MarketSmith charts are built with Investors Business Daily’s product suite.
I am an Investors Business Daily (IBD) partner and promote the use of their products. The entire platform offers a good mix of technical and fundamental data and education.
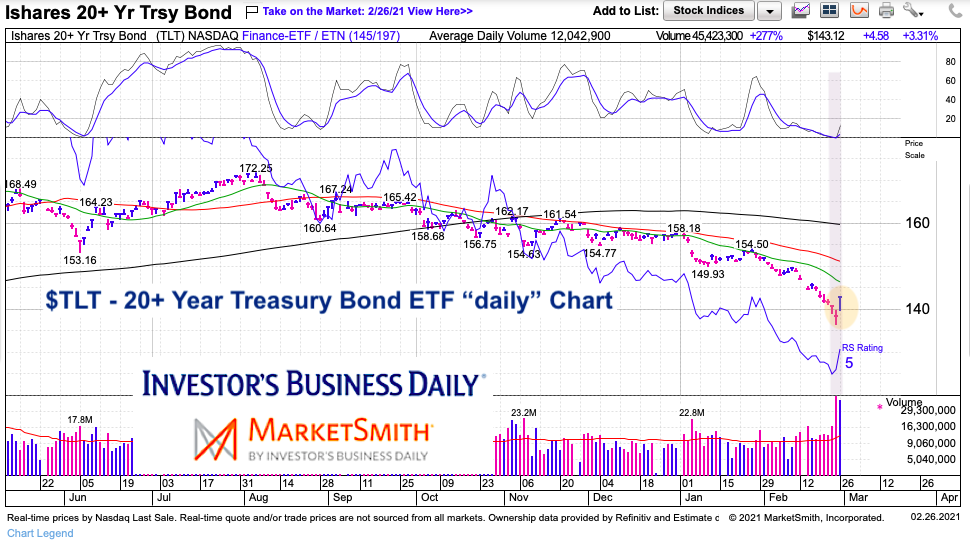
$TLT 20+ Year Treasury Bond ETF “daily” Chart
The recent reversal sticks out like a sore thumb. Last Thursday produced a decent reversal wick but Friday’s was even stronger. Treasury bonds are NOT out of the woods, but this is a good start on a potential reversal over the short-term. Momentum and relative strength fell to levels not seen since last June.
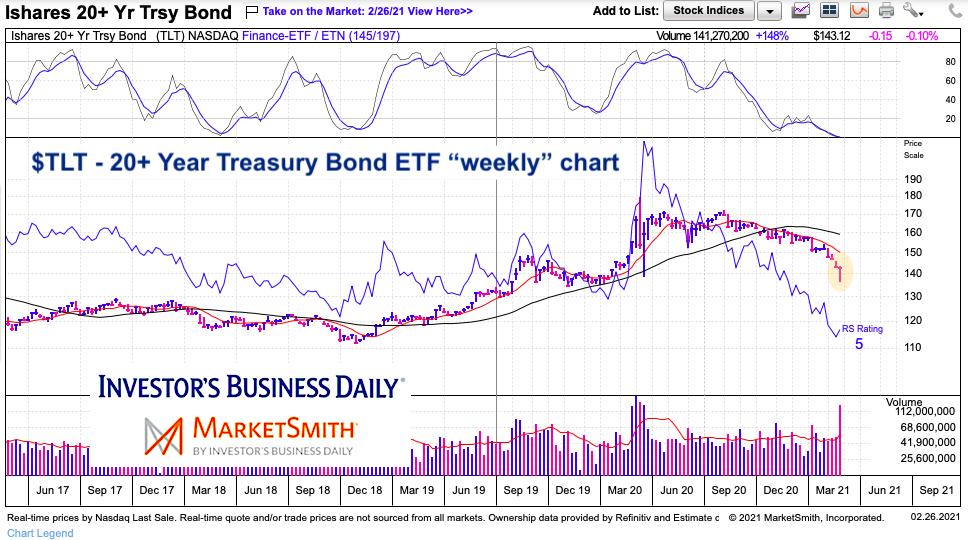
$TLT 20+ Year Treasury Bond ETF “weekly” Chart
Similar setup on the weekly chart. Momentum touching below 2018 lows. Volume is spiking. This could be a level that sees bond prices firm up and “chill out” for a bit.
Twitter: @andrewnyquist
The author may have a position in mentioned securities at the time of publication. Any opinions expressed herein are solely those of the author, and do not in any way represent the views or opinions of any other person or entity.


