The stock market is beginning to swerve up and down here at elevated levels. This has lead to some winners and some losers… and some winners that may be at risk of being losers!
Today we look at key semiconductor stock Super Micro Computer Inc (SMCI) and highlight why it could be creating a bearish reversal this month.
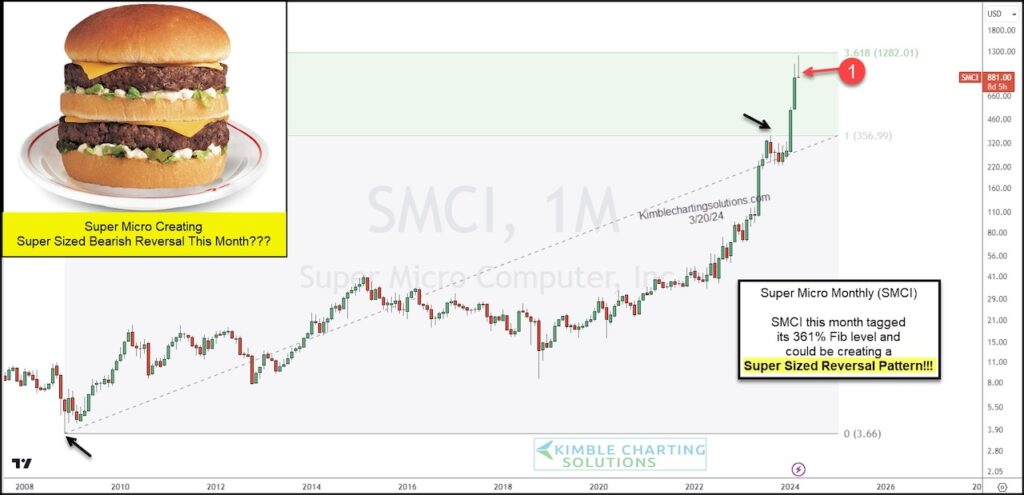
The chart below is a long-term “monthly” chart so we can see the trend, as well as individual candlesticks. As you can see, the trend is very bullish (lower left to upper right). But the turn higher over the past two years has been nearly straight up.
So one shouldn’t be surprised if SMCI’s stock price takes a breather and corrects. Perhaps that is exactly what we are seeing now.
With a few days left in the month, Super Micro is attempting to create a super sized bearish reversal pattern at its 3.61 Fibonacci extension level at (1). It’s been quite a run higher for SMCI, but is it time for a correction? Stay tuned!
$SMCI Super Micro Computer Inc “monthly” Chart
Note that KimbleCharting is offering a 2 week Free trial to See It Market readers. Just send me an email to services@kimblechartingsolutions.com for details to get set up.
Twitter: @KimbleCharting
The author may have a position in mentioned securities. Any opinions expressed herein are solely those of the author, and do not in any way represent the views or opinions of any other person or entity.

 Flirting With Critical Support… Again")


