After bottoming in September of 2016, Deutsche Bank’s stock (NYSE:DB) nearly doubled (to $21 in January of this year).
And the latest zig zag pullback is creating a potentially bullish buy setup for DB shares just below current prices.
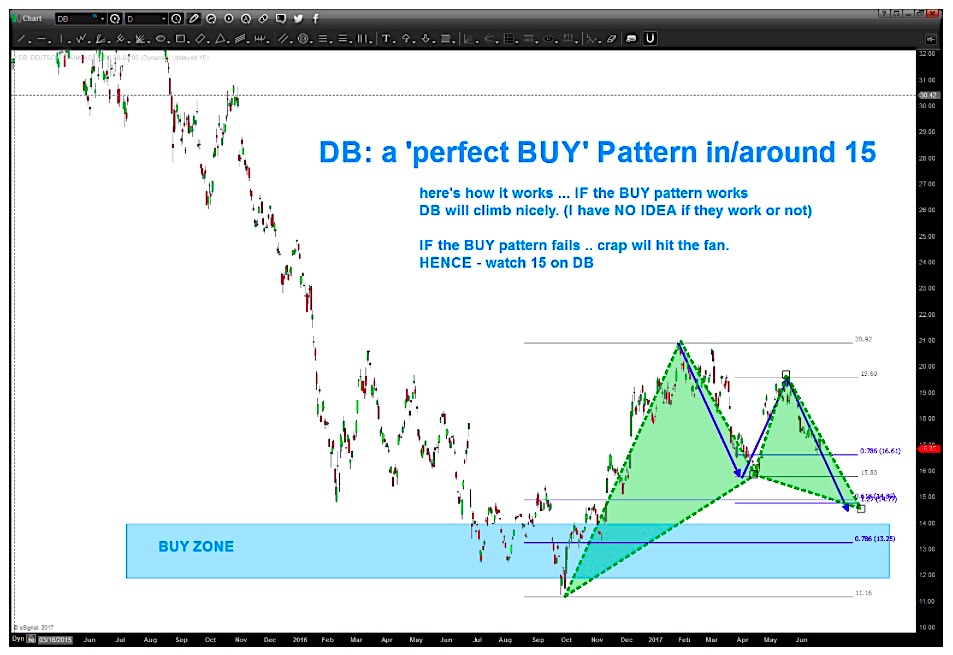
As you can see in the chart below, Deutsche Bank’s stock chart is pullback in what appears to be bullish Gartley pattern. Above I used the words “potentially bullish buy setup” because all price pattern analysis is about is creating setups and risk/reward odds that are in your favor.
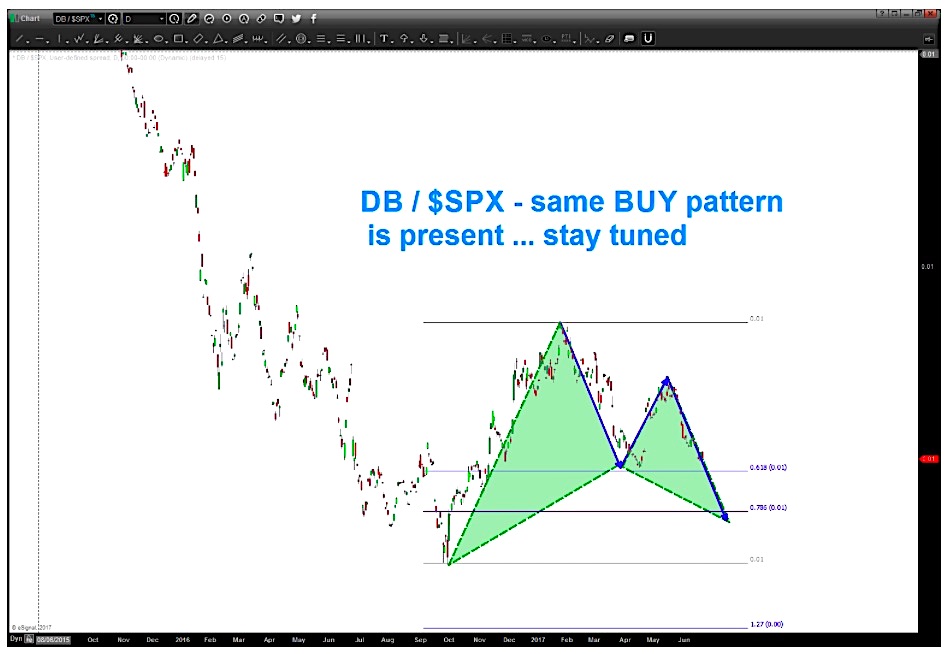
The buy setup comes into play around $14.75-$15.00. BUT if this fails, it could get very ugly, so anyone interested should use discipline (and a stop). The lower chart shows Deutsche Bank (DB) vs the S&P 500 – you can see a similar setup…
Deutsche Bank (DB) Stock Chart – Buy Setup Pattern?
Deutsche Bank (DB) vs S&P 500 Relative Strength Chart
Thanks for reading.
Twitter: @BartsCharts
Author does not have a position in mentioned securities at the time of publication. Any opinions expressed herein are solely those of the author, and do not in any way represent the views or opinions of any other person or entity.


 Ready To Break Out?")

")

