By Andrew Kassen If you’ve kept even marginally abreast of general financial market news over the last 3 months, it might feel like the phrase currency wars has taken up permanent residence in every periodical, column, and miscellaneous squawkbox abomination clip in circulation. The Japanese Yen has received the lion’s share of scrutiny in light of the aggressive debasement it has been subject to since Prime Minister Abe’s accession to power last November. Variously read as either a) an incidental, knock-on effect of prodding inflation from Japan’s secular economic torpor; or b) stealth bellicosity as Abe and his cabinet wage a moral suasion campaign against the Bank of Japan (ever the impotent interventionist) to aggressively deploy its Weapons of Mass Debasement (WMD) in an effort to pry Japan from its secular deflationary spiral.
The Yen is indisputably the Currency Wars A-Lister par excellence (congratulations on that dubious honor, by the way); but the light pollution from its torching isn’t so bright that its G7 peers are blotted out of consideration. In fact, those observing foreign exchange markets know the Euro and the British Pound have been drawn into this narrative of conflict.
Chalk it up to currency wars? Or are the ad nauseam intimations and eisegetical treatments of central bank and political communiques creating a reflexive environment, one where “war” may be manufactured from the artifice of words? Put another way, is all the talk of war dispassionately and accurately noting opening salvos out of Brazil, Switzerland, Venezuela and now Japan; or is the incessant yammering (my favored phrase when no one’s listening) creating a state of hypersensitivity to perceived skirmishes that will escalate into a conflict
Whatever its impetus – even if its origins are in pundit-conceived sensationalism – war is war.
All that can seem like an abstraction, which is great when you’re concocting a journalistic grand narrative but actually serves to occlude and obscure as one considers how to deploy capital – in spite of, or perhaps in exploitation of – in this environment. So, setting aside the favorite locus of conflict (Yen Crosses such as USD/JPY and EUR/JPY) and the depredations of the Yenkuza – ably and comprehensively covered elsewhere – let’s turn our attention to the aforementioned Euro and Pound Sterling.
To do this, we’ll evaluate the synthetic currency pair EUR/GBP (primer: long EUR/GBP is favorable to the Euro, unfavorable to GBP; short EUR/GBP unfavorable to EUR, favorable to GBP).
Because those who care all seem to be in the mood for sweeping visions of historic moment and architectonic shifts in the theatre of markets – every market note these days reads like the output of a dead Russian author – let’s look left for some history. Maybe further left than you’re accustomed to:
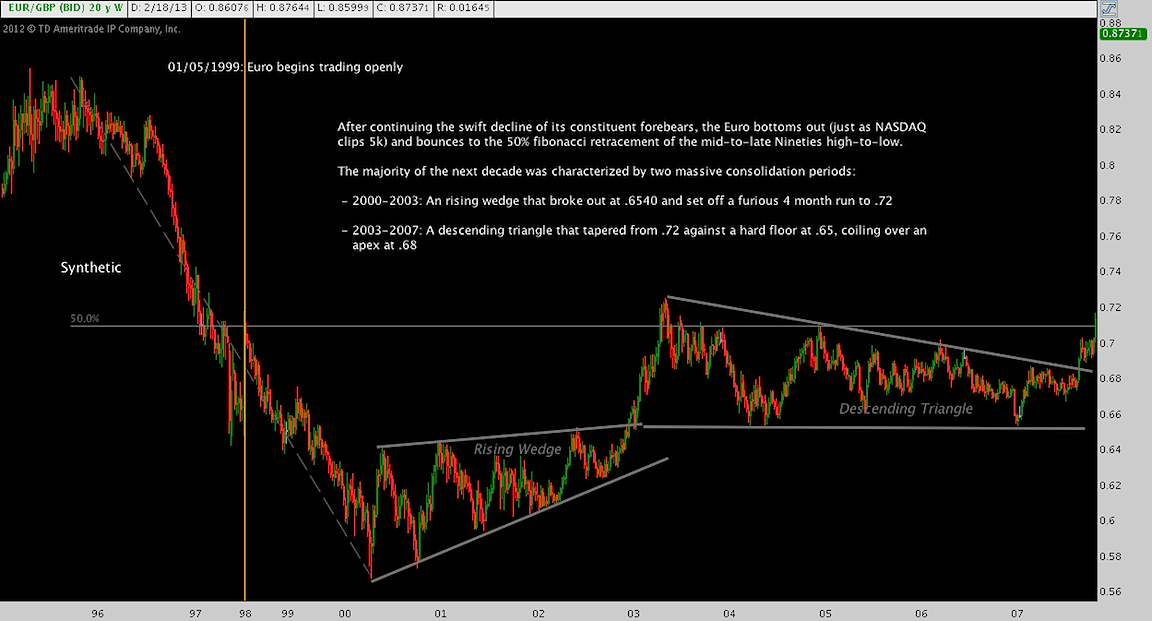
January 5, 1999: the august and venerable monetary institution that is the Euro begins trade. In addition to the notes accompanying the chart, we look at the 10 years depicted here, bracketing the Euro’s premiere in part to pry our conception of how these currencies interact out of the knee-jerk contemporary milieu of ECB and BoE policy and “currency wars!” and establish some crucial analytical distance.
What comes next? A remarkable reversal of fortune as the Euro picks up the pace against Sterling (again, consult supplemental notes in-line for the technical breakdown):
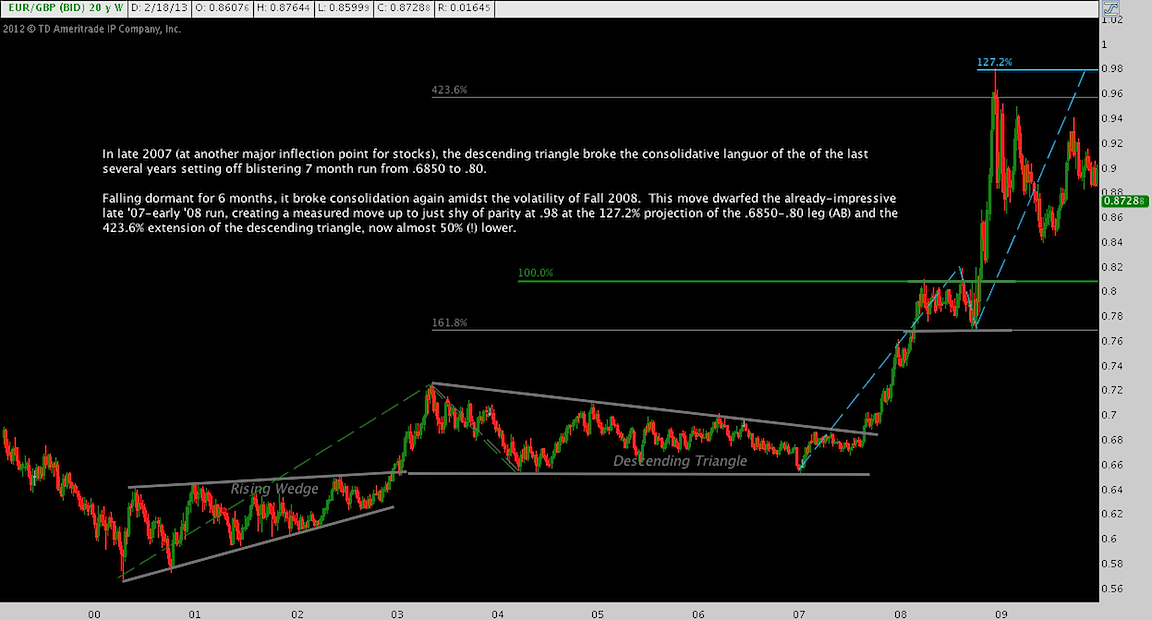
The groundwork laid, we come to the present moment. The Euro has seen better days (check out the great German D-Mark height of the mid-Nineties from which it thence toppled, the inheritance of the Common Currency). However, though the step back begun in early 2009 (as equity markets began to rebound) is significant, it remains a correction only and not not the stuff of secular relative strength in the Pound.
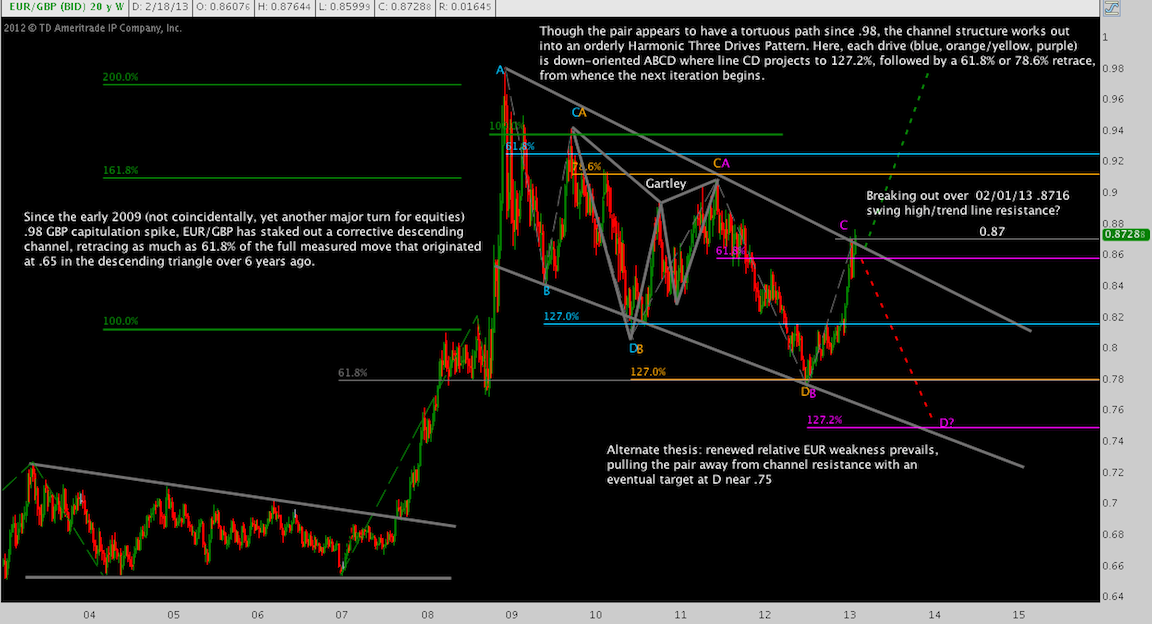
Talk about a busy chart (no worries: there aren’t half a dozen potential EW counts coming in the next one), eh? At a glance: the Euro has been in a 4 year correction against the Pound. There have been several noteworthy incursions, each falling to create the strophe-antistrophe pattern that is the descending channel you see.
Don’t dismiss the details: prima facie there is a descending channel here – that much is obvious. The structure inside, though, is highly insightful. Off the .98 blowoff peak (technician Sarah McLachlan likes to call this one one Fumbling Toward Parity), a “Bullish Three Drives pattern” has emerged from the succession of lower highs and lower lows. Taking back as much as 61.8% of the 2007-2009 advance to a low at 0.78, EUR/GBP has fulfilled the technical criteria that presages an upside break. In fact, you’ll note that this week’s candle is a breakout-in-process, with Friday’s close and next week’s (non?)confirmation candle deserving very close attention.
Fascinating (hopefully); but these are weekly charts. A position trader coud benefit greatly, but how does a shorter-term operator turn this analysis into action? Glad you asked.
All great trend following or position trades begin when a scalp ticks into the minimum increment of profit within one’s PnL. In the case of EUR/GBP, how could that conceivably work out?
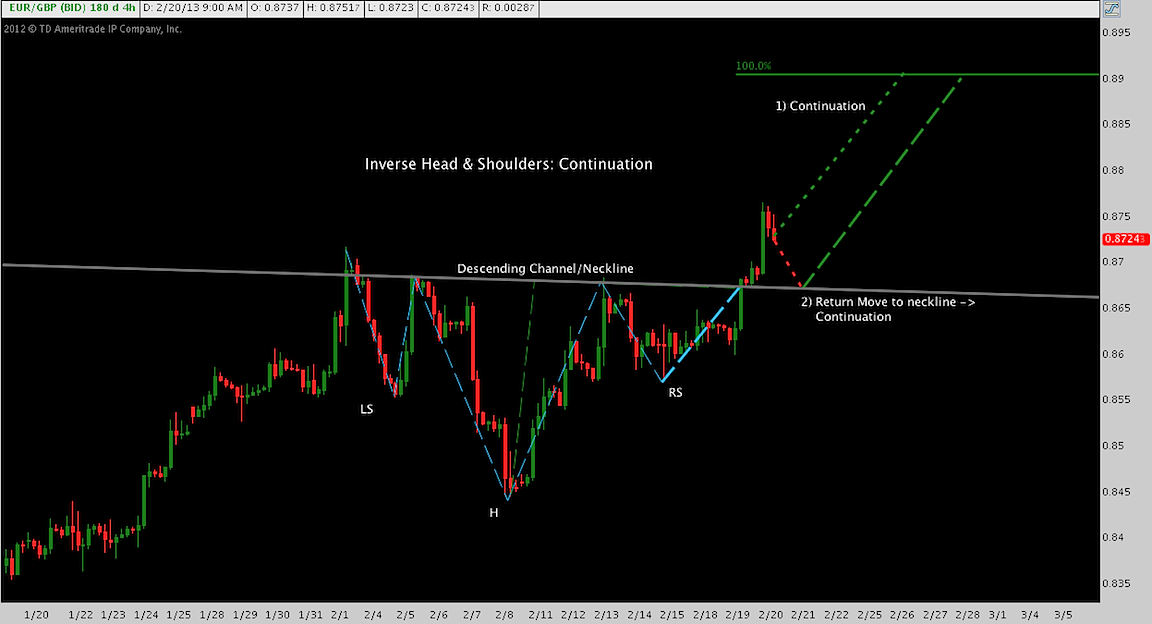
Everything to this point has been top-down, context-seeking analysis. So far, so good. Now, down in the weeds of a 240-minute chart, day and swing trading opportunities comes into focus (call it the trenches of the currency wars).
One such opportunity is the Inverse Head-and-Shoulders continuation pattern that coalesced around 0.87 out of the struggle around the descending channel’s upper trend line. Will EUR reassert its 2007-2009 dominance and break out of its long sojourn in the corrective wilderness? This is another question for history books (watch for the sequel to this post in 2018) that we don’t presume to answer.
That said, the Inverse H&S has broken out to the upside: it’s neckline is exactly confluent with 4 year descending channel resistance. If the Euro is about to enter a new cyclical relative strength regime v. Sterling, it could well be happening right here.
It’s important to consider that this pattern may fail: the GBP may retake .87 and pull the Euro down into the abyss of 0.74 or lower. The macro accidents that would accompany such a move are interesting to ponder (though I’d stress they have no room in an agnostic process such as this). For now, one can simply react to the manifest fact of the neckline break managing risk against the price projection of 0.89 you see here. A pattern failure here tells the long and short-term trader alike that the descending channel is back in focus and perhaps the Pound is not quite ready to wave the white flag of surrender against the Euro.
Whatever happens with the Inverse H&S, EUR/GBP is at a significant waypoint, standing on the edge resuming a secular EUR strength theme or sliding further. Perhaps that sound like a coin flip; but managing risk effectively against the middle that is trend line resistance/0.87 – whether EUR or GBP bullish, long or short – will yield significant results.
Twitter: @andrewunknown and @seeitmarket
Long EUR/GBP at the time of publication.
Any opinions expressed herein are solely those of the author, and do not in any way represent the views or opinions of any other person or entity.


