Over the past year, I’ve shared several point and figure charts for the S&P 500. Today, we’ll use point and figure to analyze the US Dollar Index and look for clues as to its next move.
I believe we can use point and figure charting of the USD to see where major support and resistance lie… and how price reacts at these levels will give us insights into its direction and trend.
First, some background on the US Dollar point and figure chart.
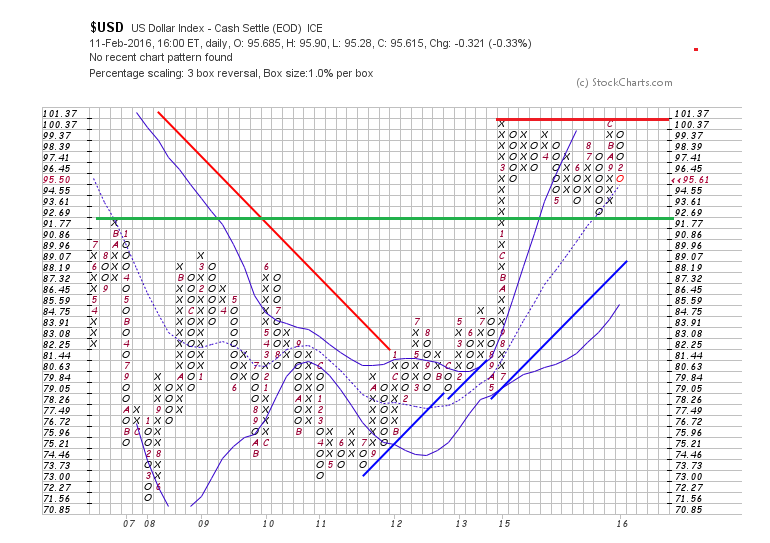
In September of 2014 the US Dollar Index had a major breakout when a double top buy signal generated with a print of 85.59. That print offers a 121.18 Price Objective using a horizontal count (using the column of X’s that generated the buy signal and using the column of O’s going down off the 2010 high of 88.19). Frankly, that’s a very ambitious price objective for the USD but there are several vertical counts that occurred before the aforementioned breakout which would be more conservative in establishing a price objective.
A good example of a vertical count is the one established in early 2012 that ran into resistance at the downtrend line and went live with a double top buy signal in May of 2014 with the 82.25 print. The price objective established at that point was 93.26.
Let’s go back to the column of X’s that occurred after the double top buy at 85.59. One may have thought that old resistance of 91.77 from 2006 may have been a good place for the US Dollar point and figure chart to take a breather, but the move was robust and continued without hesitation until the US Dollar Index hit 100 in March of 2015.
At that point it was time for the dollar to give back some of that move and distribution began with the first sell signal generated in April 2015. But looking at the chart and more importantly the Bollinger Bands, we can see the uptrend was very much alive. Three months later in July another double top buy signal was generated confirming that buyers were still there for the dollar.
What happened shortly after that buy signal is notable in my opinion and offers where I believe to be major support for the USD. As you can see below on the US Dollar point and figure chart, a reversal occurred after the buck printed 98.39 in August and a new column of O’s led to a double bottom sell at 92.69. Let’s do a little analysis here. Looking at the Bollinger Bands which were in an uptrend at the time, price action stopped right at the moving average. Also and more importantly old resistance of 91.77 held as support as highlighted by the horizontal line. In addition upward price action reestablished itself and a double top buy signal occurred at 99.37 in November.
Thanks for staying with me to this point. So what’s this all mean? Price ran into resistance again at 100.37 again and reversed lower. We currently have downward price action with a column of O’s sitting just above the moving average. If price continues downward and drops below the moving average and breaks support at 91.77, I believe there will be more downside and the primary trend on the US Dollar point and figure chart will no longer be to the upside.
That said, at this point the trend is still intact and a breakout above 100.37 will confirm the continued strength in King Dollar.
Thanks for reading and have a great week.
Twitter: @Snyder_Karl
The author does not have a position in any of the mentioned securities at the time of publication. Any opinions expressed herein are solely those of the author, and do not in any way represent the views or opinions of any other person or entity.


: Showing Some Signs of Emerging Strength")
