All eyes on Crude Oil prices. The downturn has been relentless and traders are now trying to figure out where the bottom will be. Normally, I only chart Crude Oil Futures on a daily basis, but with the recent collapse in futures prices I wanted to apply my Fibonacci method to some longer time frame charts to ascertain where the price of Crude Oil may be headed.
If you follow me on the many social networks I post on, you know my method gives reliable targets as well as exit points if the trade goes against you. Please feel free to read and follow my work here on SIM and on my blog.
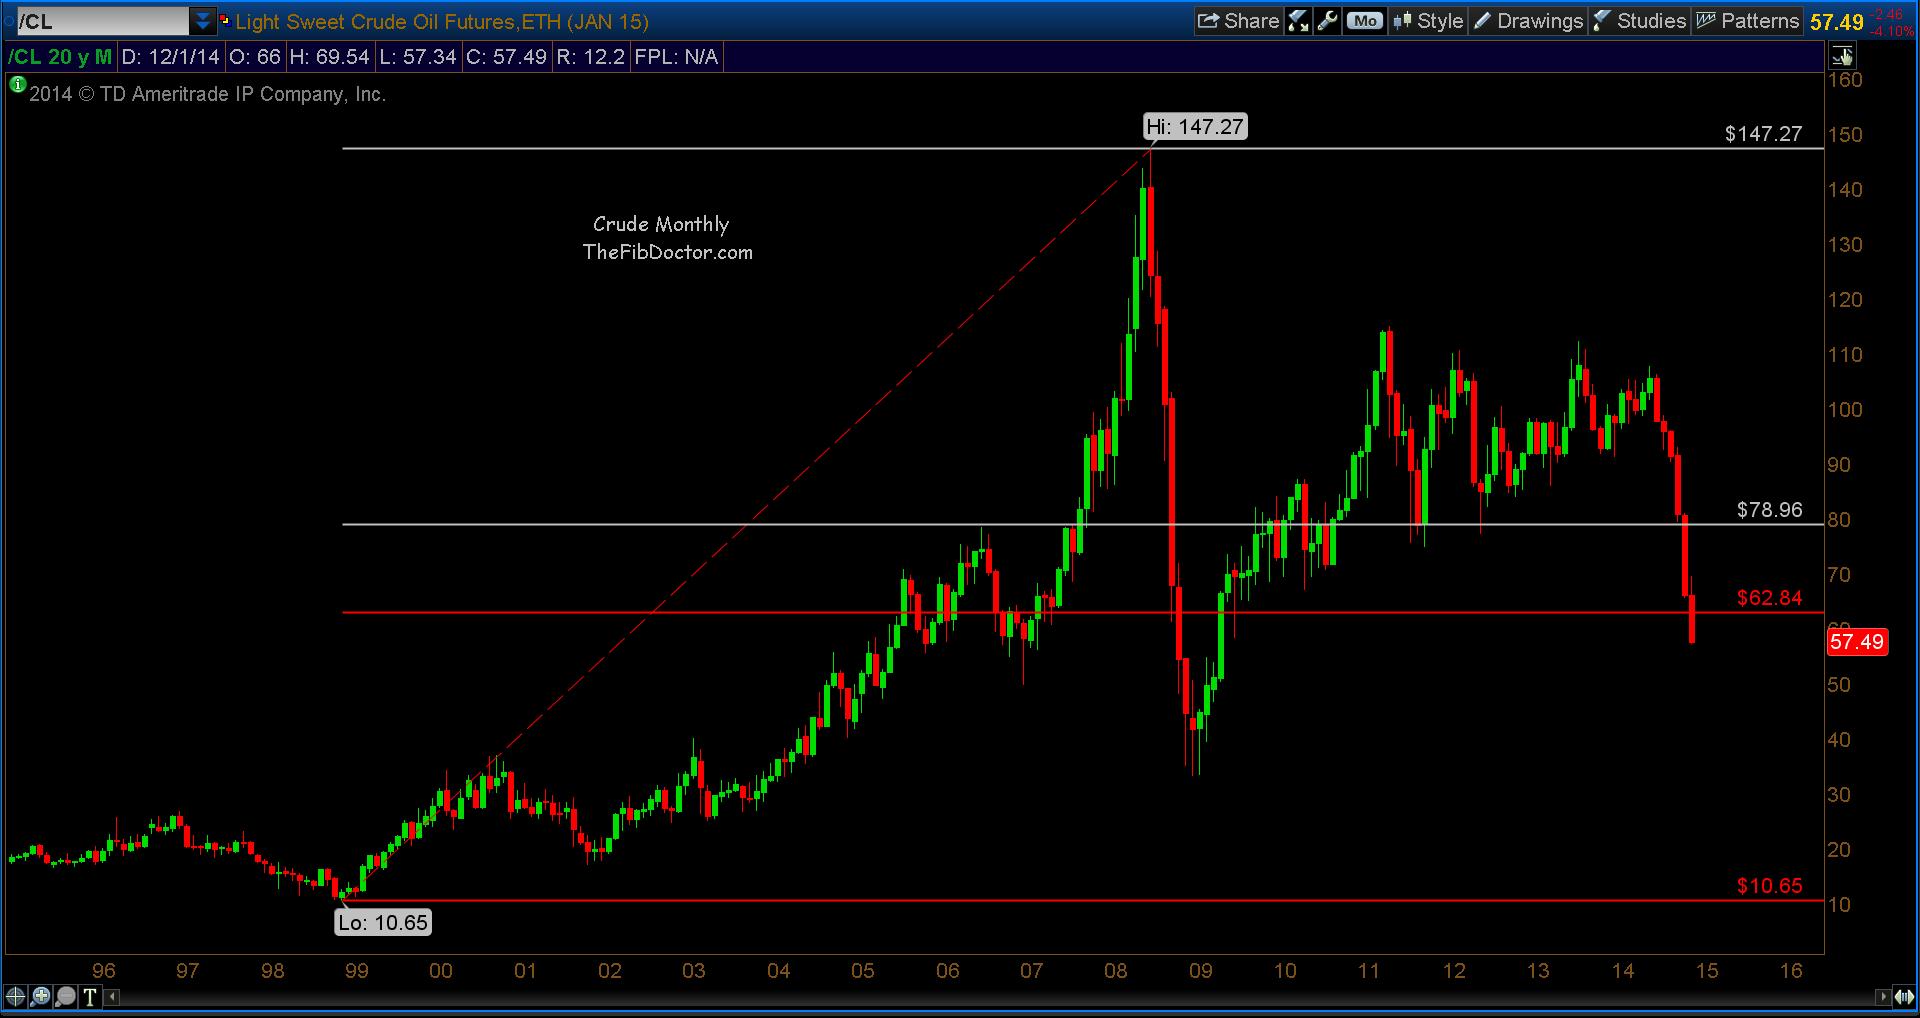
So let’s get started with the big picture, a 20 year, monthly chart.
In the chart below, you can see:
- Crude Oil prices moved from a low of 10.65 in December 1998 to a high of 147.27 in July 2008.
- That’s a monster gain of 1,282.81%.
- Two crucial levels of support (long term) of 78.96 and 62.84.
- The 2nd support level of 62.84 has been violated.
- There are only 10 full trading days left in 2014
- Crude would need to close above 62.84 before the end of the year to maintain this support level.
Light Sweet Crude Oil Futures 20 Year, Monthly Chart (click charts to enlarge)
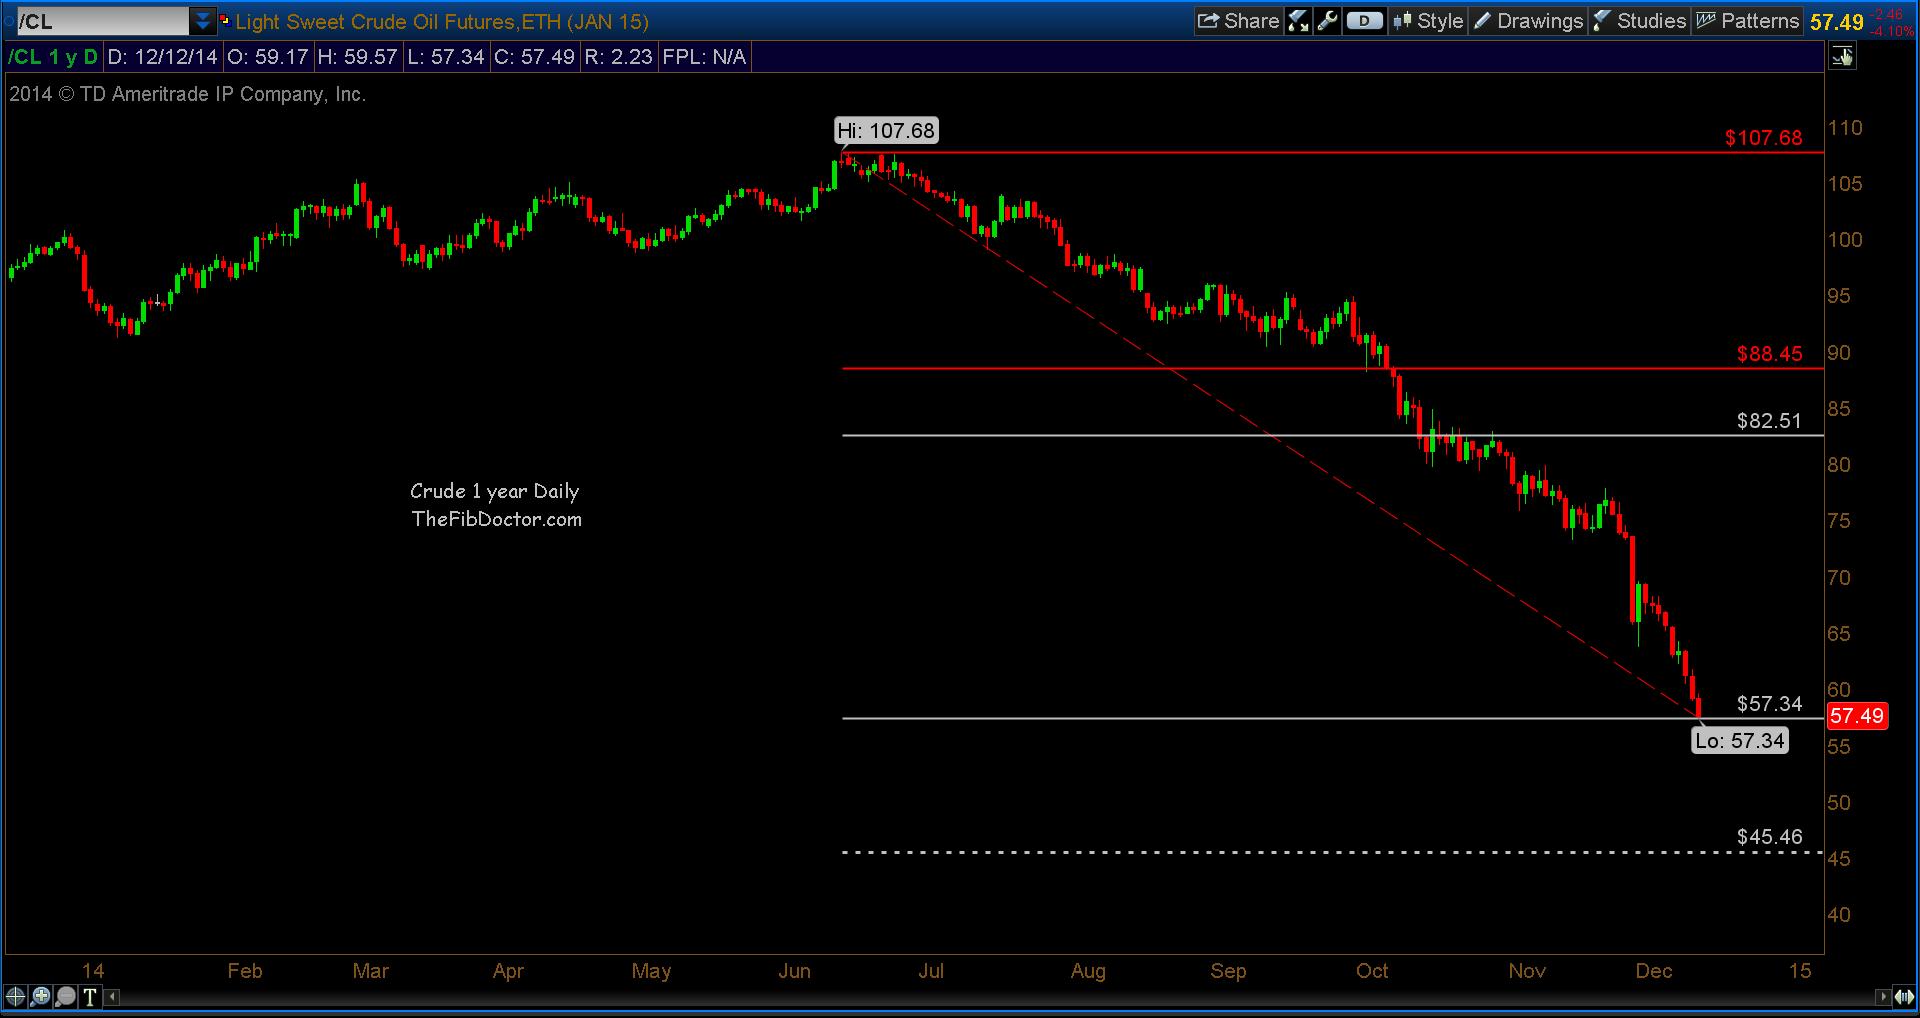
Now let’s drill down to a shorter time frame and see what levels we find. In the 1 year, daily chart below we see:
- A high of 107.68 was made on June, 13th, 2014.
- Price dropped to 57.34 on December 12th, 2014.
- That’s a move of (-46.74%).
- This creates a daily target of 45.46.
- Two resistance levels of 82.51 and 88.45. Keep in mind these are longer term levels.
Light Sweet Crude Oil Futures 1 Year, Daily Chart
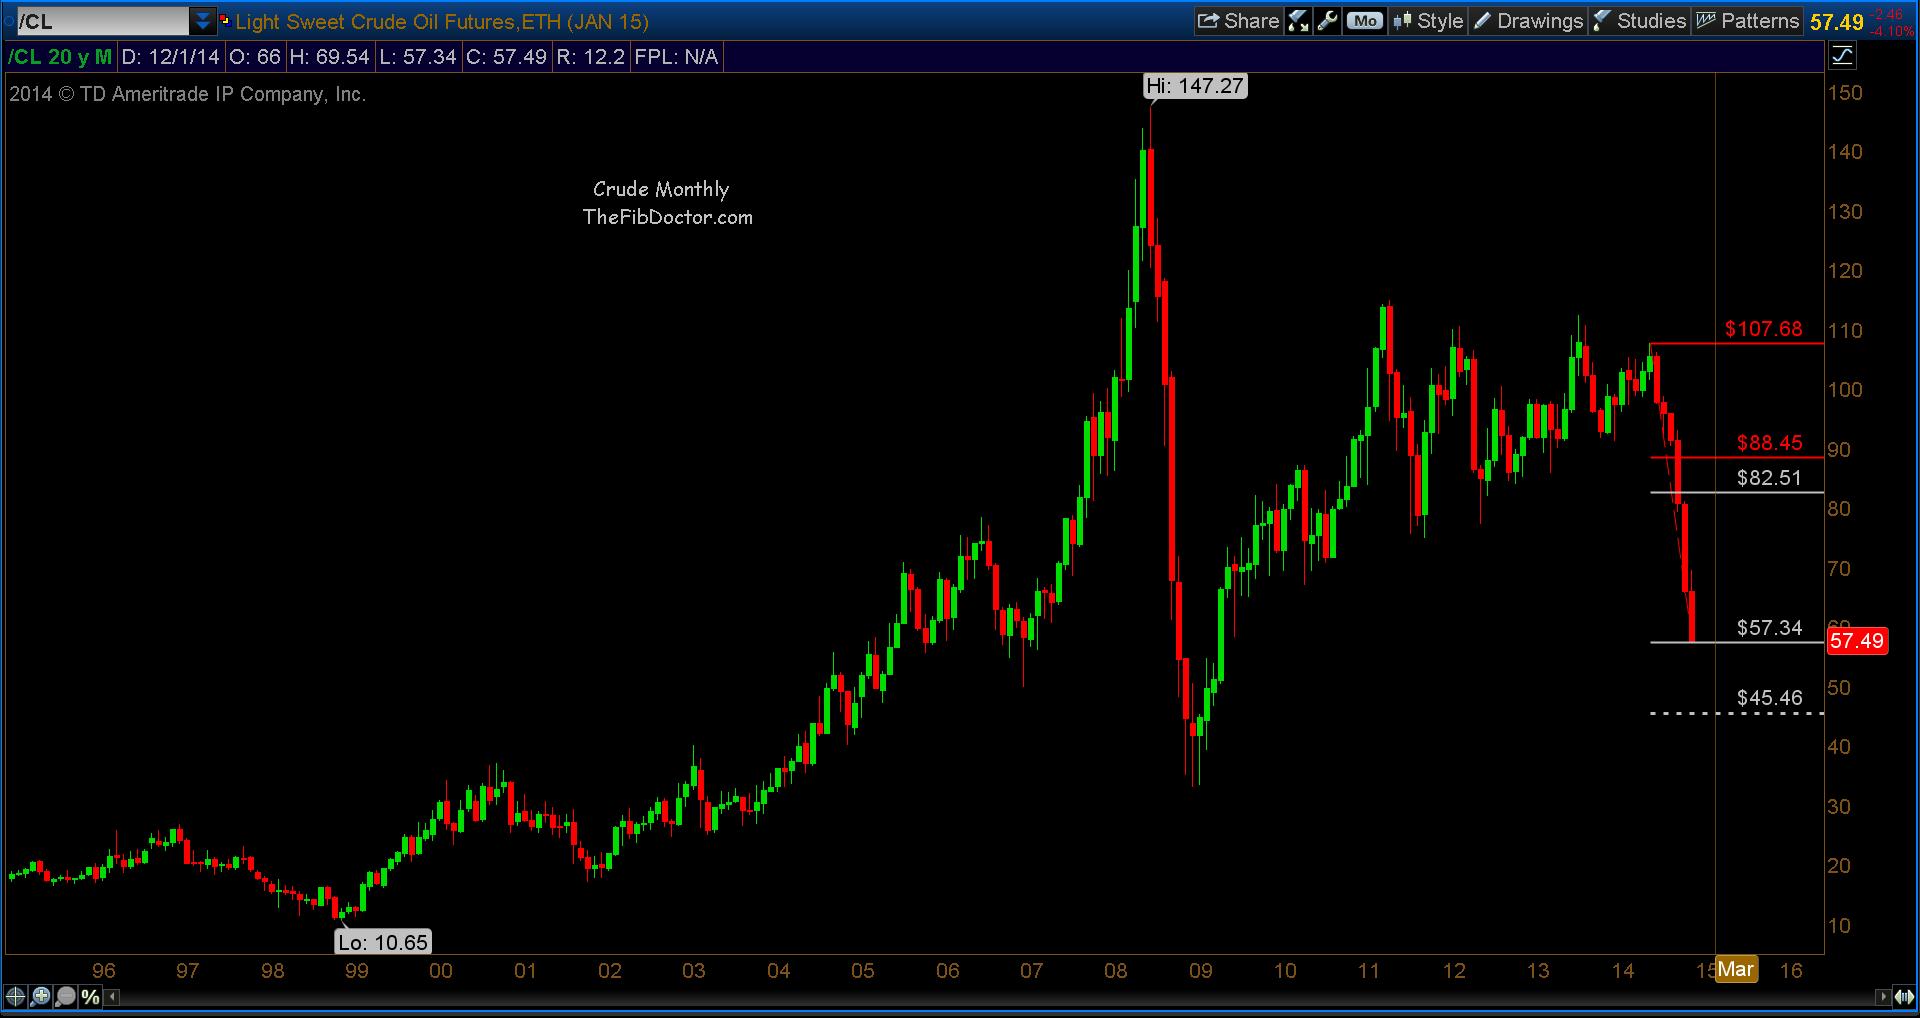
Now let’s go back to a 20 year monthly chart except this time after doing drawings and calculations I was able to find the correct drawing for shorter term Fibonacci levels.
In the chart below, you’ll see something very interesting; the target of 45.46. This is the same target derived from the Fibonacci levels on the 1 year, daily chart.
For now, I’ll monitor the monthly close to see if prices can reclaim the 2nd support level of 62.84. I’ll revisit Crude Oil Futures in January 2015.
Light Sweet Crude Oil Futures 20 Year, Monthly Chart
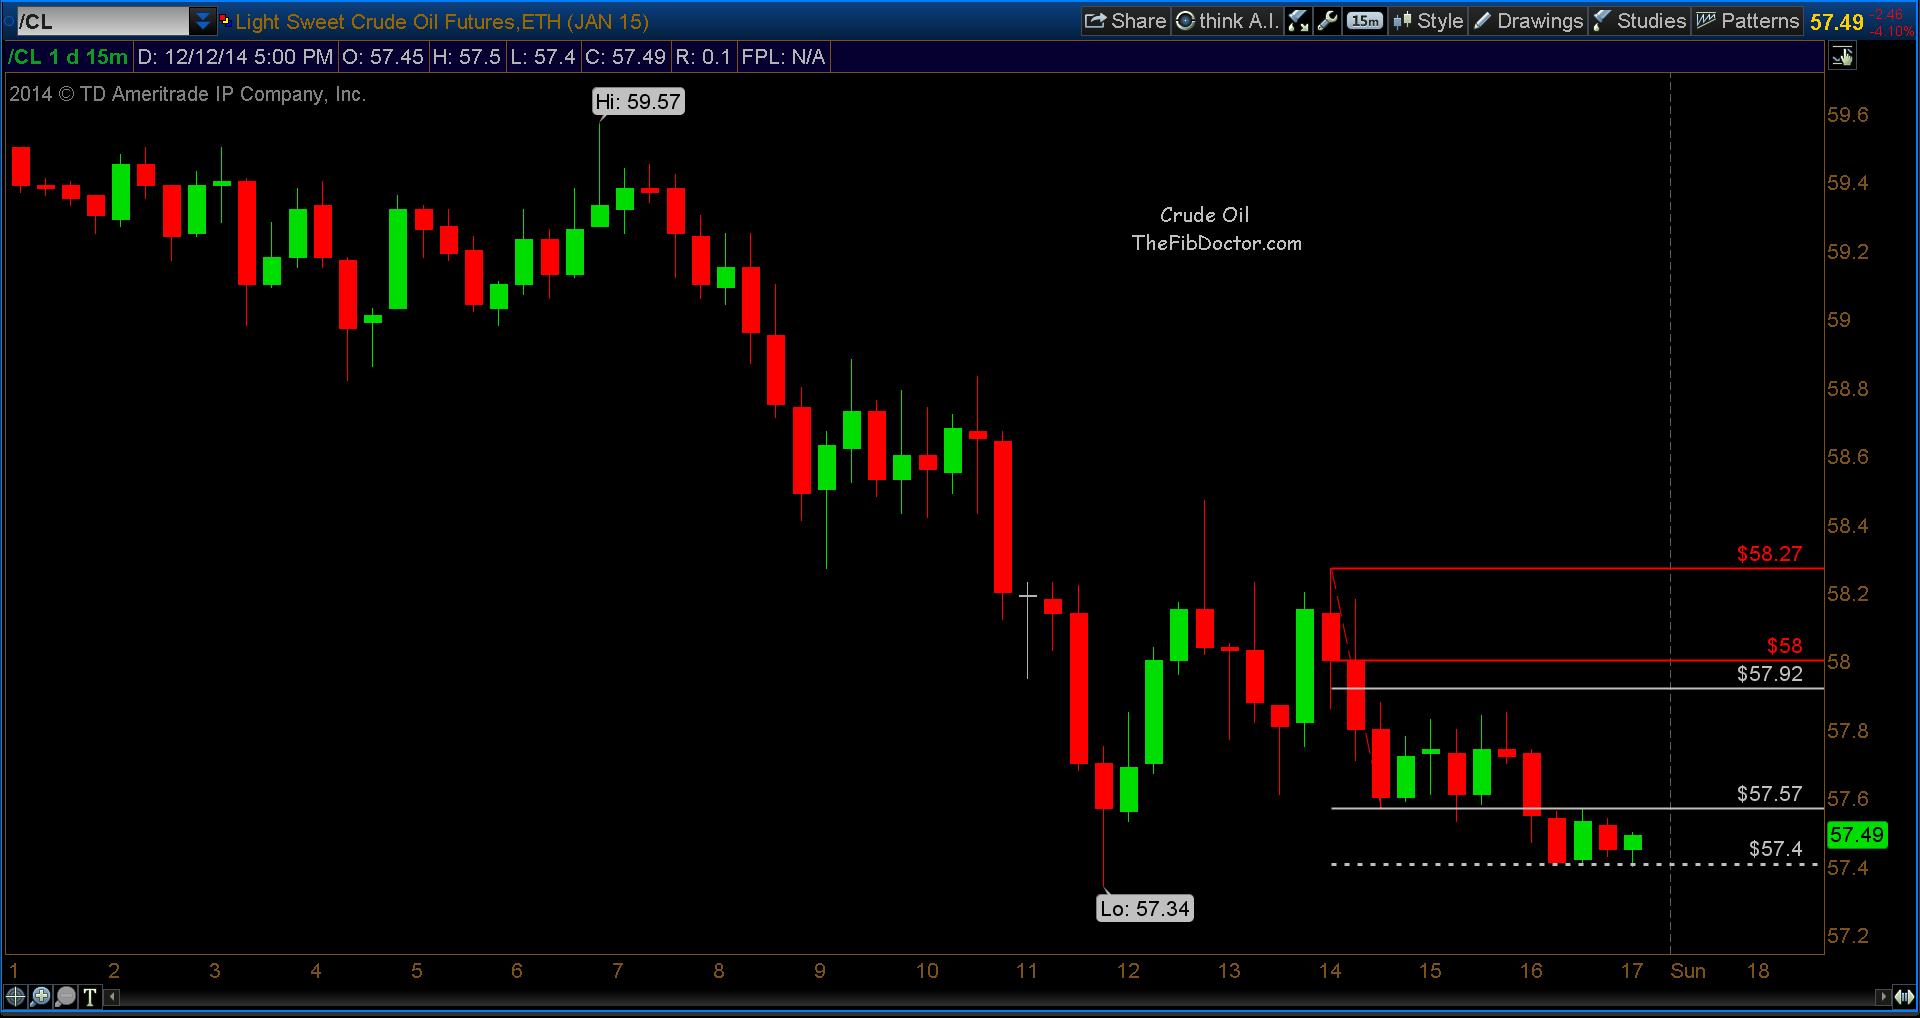
And lastly, on a 15 minute intraday chart, the last target derived on Friday, December 12th was 57.4. That target was hit and held going into the close Friday. We’ll need to keep an eye on this as futures open Sunday night.
Light Sweet Crude Oil Futures 1 Day, 15 Minute Chart
Remember to always use a stop. Thank you for reading.
Follow Dave on Twitter: @TheFibDoctor
No position in any of the mentioned securities at the time of publication. Any opinions expressed herein are solely those of the author, and do not in any way represent the views or opinions of any other person or entity.

: Showing Some Signs of Emerging Strength")
