The big news of the morning is the global effort to ease continues with China’s rate cut and Mario Draghi’s strong words, “It is essential to bring back inflation to target and without delay.”
Crude Oil (WTI – Quote) certainly has gotten the message ahead of OPEC’s key Thanksgiving Day meeting next week. As we speak, Crude Oil has broken a 1 month downtrend and is attempting to regain an important pivot level. The chart below shows the original “pop” but prices have since faded back towards 76.00.
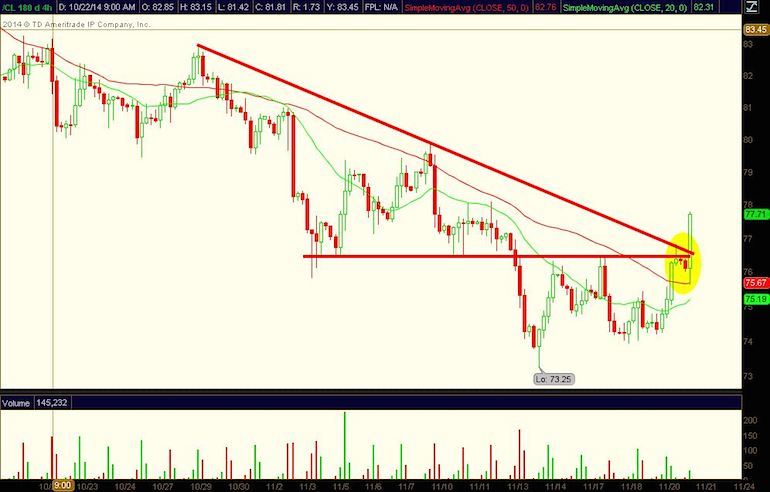
chart courtesy of TD Ameritrade
If this breakout holds and prices end the day higher, the intermediate-term moving averages will likely confirm a trend change. This is important as Oil prices test the falling 20 day moving average in the high 77’s.
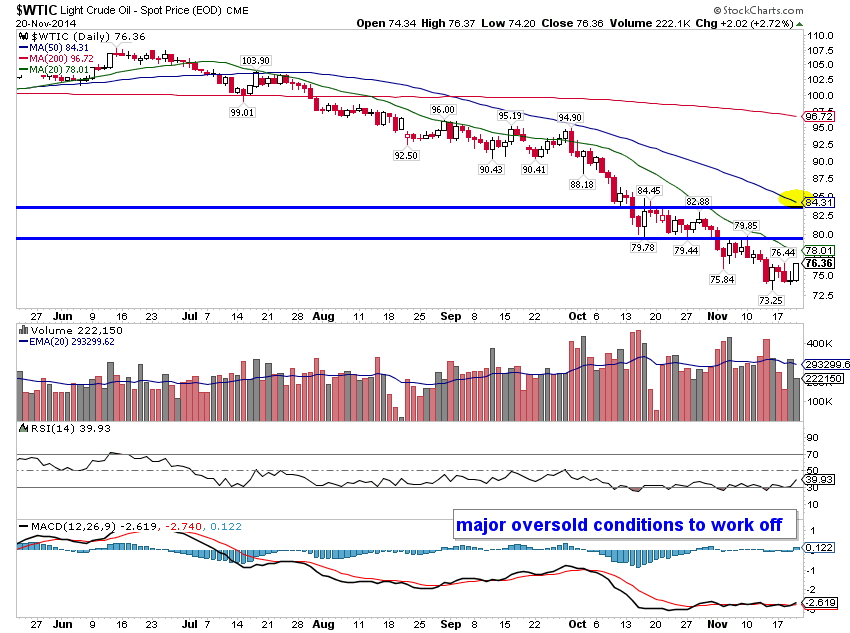
Crude Oil Price Levels to watch:
- Support – The 76.50 area will continue to be an important pivot level in the future. Below that 75.25 and 74.00 are worth noting on a lesser scale.
- Resistance – On the upside, psychological resistance at 80.00 lines up with a prior pivot zone from earlier in the month.
Above that, the falling 50 day moving average is coinciding nicely with a pivot level in the 83-84.5 area. See chart below.
Thanks for reading and have a great weekend!
Follow Aaron on Twitter: @ATMcharts
No position in any of the mentioned securities at the time of publication. Any opinions expressed herein are solely those of the author, and do not in any way represent the views or opinions of any other person or entity.


