Why am I looking for SUPPORT in Crude Oil and the Oil Services Index (OSX)? Because, as you will see, they correlate nicely to the US Dollar (USD) vs. the Canadian Dollar (CAD/Loonie) and as a spot FX trader/investor I like to see as many correlations as I can. It’s that simple…
Am I trying to “catch the falling knife of crude?” No
Am I trying to “make a great call?” No
I am trying to figure out a cross correlation of the OSX and Crude Oil to see which level below on the USD vs CAD will hold so I can BUY the LOONIE and SHORT the USD.
If you want to spend some time studying these key relationships, I recommend go back and read this post. The key technical aspect to notice is the Loonie and Oil Services index (OSX) were moving together. And, historically, they have been mirror opposites. Why did this correlation break down or even exist? I don’t know and I don’t care. As a chartist I just look at the chart and we could see “something was a foot at the Circle K” (Bill and Ted’s Excellent Adventure reference).
Here’s the current weekly chart of the USD vs LOONIE. As expected, the Dollar has been cruising ever since finding support (see blog above) on the very large (IN TIME) bottom.
THESIS: the correlation is back to what it used to do.
- Dollar STRENGTH vs LOONIE causes weakness in OSX.
- So IF LOONIE strengthens THEN OSX “should” (operative word here) find support.
LOONIE chart showing a lot of ratio’s and patterns coming together.

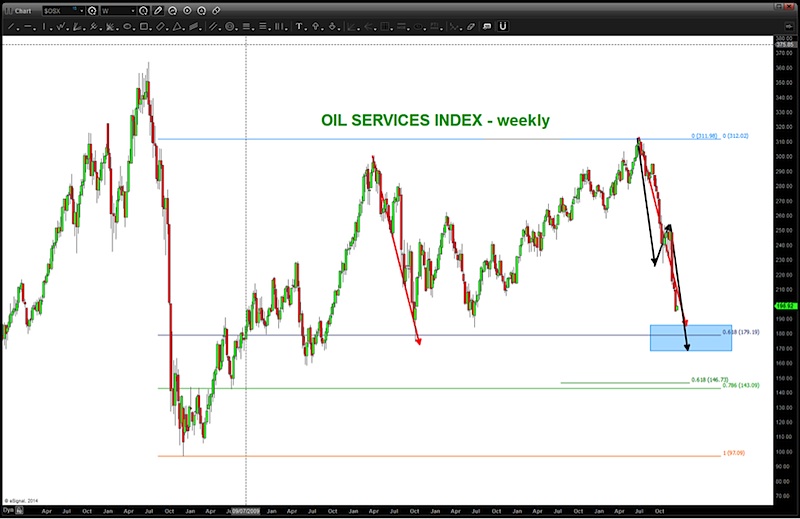
Now here’s a look at the Oil Services Sector (OSX). Note, we still haven’t corrected as much as we did in October 2011 in both price and time.
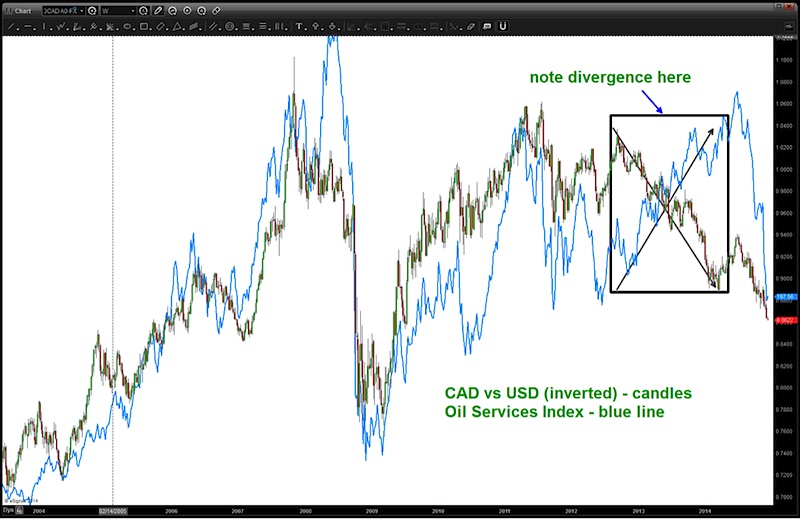
Now let’s look at the OSX and the USD vs CAD – note the divergence that existed between 2012-2014. Something was going to give… now they are synced.
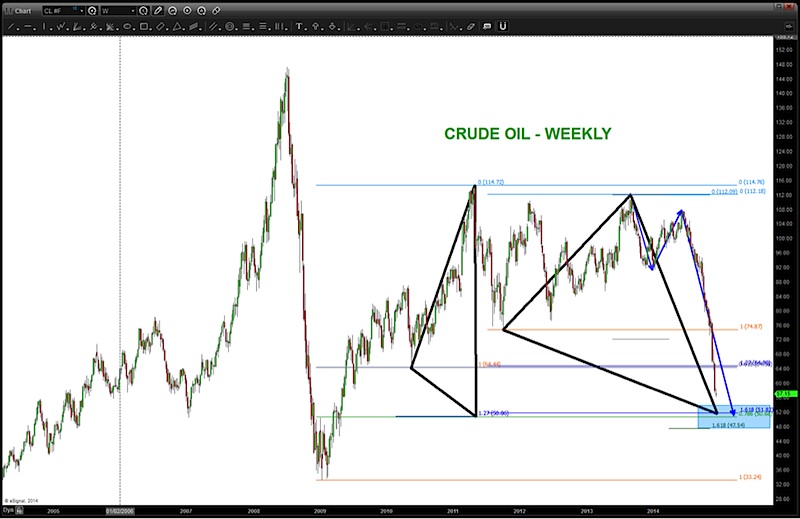
One last chart. Here’s Crude Oil with a target of 50ish. Note, the overlap at the .618 got smoked. Will this level at 50 hold? I don’t know but it’s the next logical target for Crude.
So, in summary we are going to be looking out for simultaneous targets to be hit on the Loonie vs the USD, the Oil Services Index and Crude Oil before entering a position. Could be a couple more weeks…
Thanks for reading!
Follow Bart on Twitter: @BartsCharts
No position in any of the mentioned securities at the time of publication. Any opinions expressed herein are solely those of the author, and do not in any way represent the views or opinions of any other person or entity.
 Rolling Over At Key Fibonacci Level?")


