One of the more useful (and apparently underused) tools I’ve stumbled on in macroeconomic analysis is the Kalecki Profit equation for evaluating corporate profit margins. It’s frequently joked about that Eastern Europe has its own version of everything (tv shows, cars, etc…); sure enough, they had their own Keynes. Michael Kalecki was a Polish economist who discovered (and was not the only one to do so, although he is regarded as one of the first) the macroeconomic relationship between corporate profit margins and certain macro variables. For those who are unfamiliar with it, here is a simple derivation.
- Start with a completely closed economy. Given that, it is then true that total incomes in this economy must equal total expenditures. Mathematically, Income = Expenditure
- How can we further subdivide “income” and “expenditure” in this closed economy? Well, the only sources of income would be profits (to those who own the means of production) and wages (to those who do not). Breaking down expenditure, the only two outlets for capital in a closed economy are consumption (by the wagemaker, per se) and investment by the businesses (after depreciation). Mathematically, we now have Profits + Wages = Investment + Consumption.
- Now, let’s isolate the profit variable (bearing in mind that this is still a closed economy). We then have: Profits = Investment + Consumption – Wages.
- Since to this point we’ve assumed that wagemakers do not own the means to production (making wages their only source of income), it’s safe to say that in our closed economy, “Consumption – Wages” looks a lot like household savings, except the signs are the wrong way. Flipping them, we get: Household Savings = Wages – Consumption
- Now, if we hadn’t derived household savings from those two variables, but wanted to represent it in the equation at this stage: Profits = Investment – (Wages – Consumption). Subbing in household savings for the variables in parenthesis, we arrive at our profit formula for a closed economy. Profits = Investment – Household savings.
- Needless to say, we don’t live in North Korea, so this formulation of profits won’t do for our economy. So let’s open it up by adding in the variables that make a complex open economy distinct from a simple closed economy.
- Government deficit – if the government runs a surplus, this is a drag on profitability. If they run a deficit, this is a boost to profits. Hence, our equation now looks like this: Profits = Investment – Household savings – Government Surplus (Deficit)
- Current account – since we do trade with other countries, we need to account for it. If we owe other’s countries money, that’s a drag on our profitability and a boost to theirs (the reverse is true in a current account surplus). This brings our equation to: Profits = Investment – Household savings – Government Surplus (Deficit) – Foreign Savings
- Dividends – in our closed economy, we assumed that the only transactions between corporations and other entities (i.e., households in that case, but in our open economy, that could be other corporations, governments, households, etc….). Dividends paid represent a profit to anyone who received them, which can further be invested or spent. Therefore, we arrive at our complete profit equation: Profits = Investment – Household savings – Government Surplus (Deficit) – Foreign Savings + Dividends.
(Derivation based on James Montier’s explanation in his GMO March 2012 white paper – What goes up must come down!)
Now, learning that wouldn’t be any fun if there wasn’t an example. I’ve pulled data for the United States on corporate profit margins from 1969- 2012 and found some interesting trends worth sharing.
Historical Corporate Profit Margins Chart – click to enlarge chart.
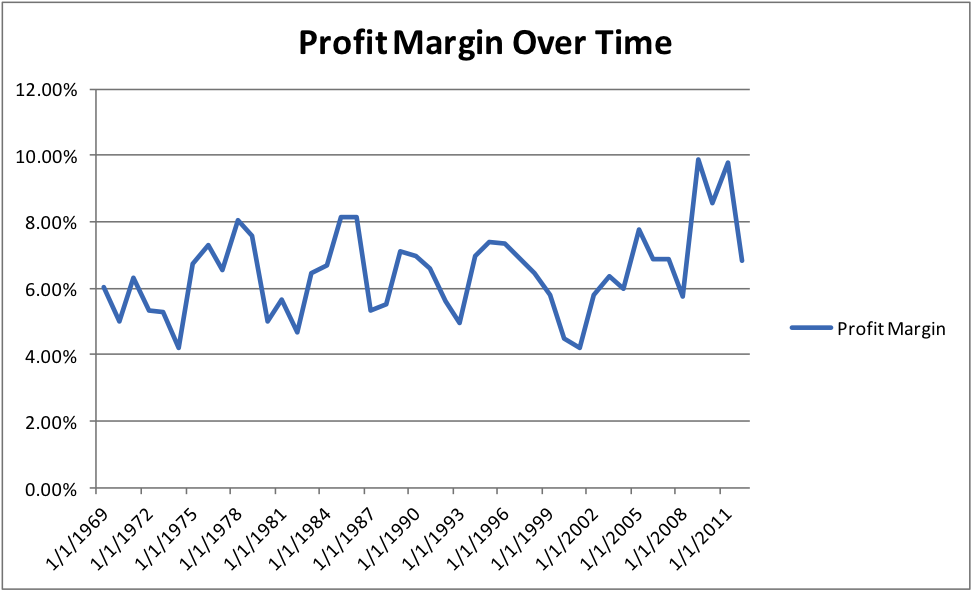
The first point worth making is that over the last 43 years, corporate profit margins were never as high as they were in 2009, 2010 or 2011. It seems that we’ve begun a reversion to the mean of about 6.5%. This was clearly the result of the U.S. stimulus package.
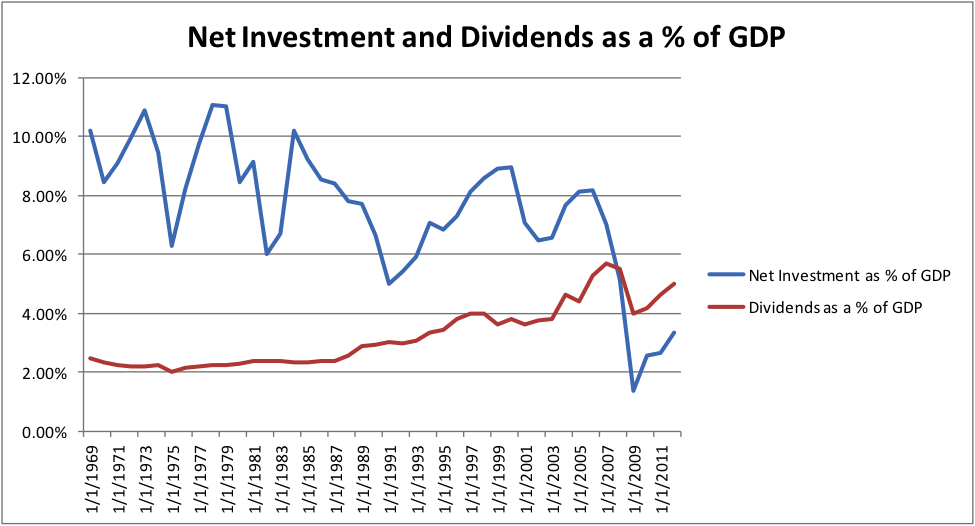
The next trend I’ve identified (and is my main motive for sharing this) is that of dividends and net investment. Over the long-term, net investment as a percentage of GDP is gradually declining, and dividends are gradually increasing. See chart below – click to enlarge.
– And here is the chart smoothed out using a three year simple moving average:
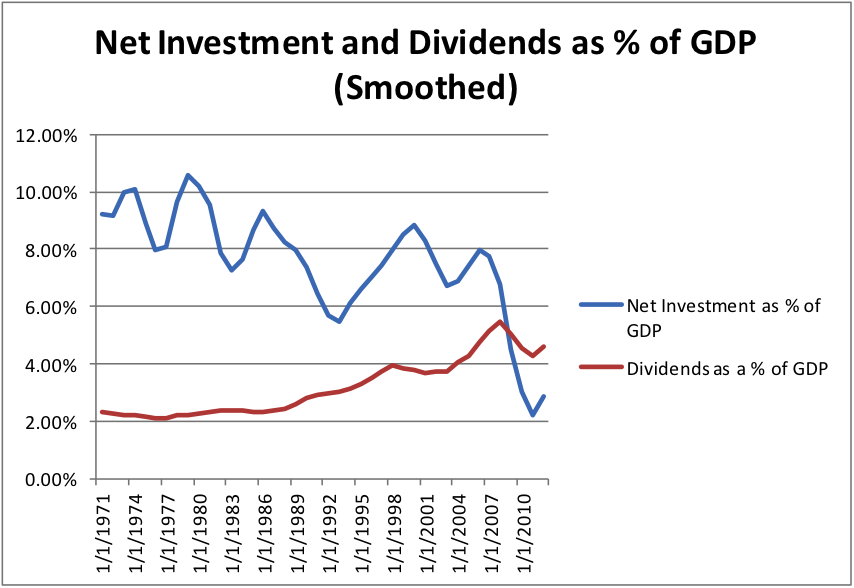
While it’s clear that we cannot grow indefinitely (resulting in dividends representing a larger and larger proportion of GDP), one question in the back of my mind is whether this is the cause of the “New Normal” that Bill Gross coined.
Theoretically, once our economy is ‘maxed out,’ the only investment we’d ever make is to replace worn out capital, which, presumably, would roughly equal total economic depreciation. The result would be that net investment as a percentage of GDP would be zero. Are we reaching that point?
Anyhow, if you think this is a temporary trend, feel free to share your reasoning!
Twitter: @maxmoore306 and @seeitmarket
Any opinions expressed herein are solely those of the author and do not in any way represent the views or opinions of his employer or any other person or entity.

 Testing Important Price Support")
: Cup (and Maybe Handle) Watch")

