Corn prices are trading higher today and have pushed Corn back up to the recent price highs around $3.85. Prices are a bit higher since my last update on the Grains sector. In that post, I highlighted key resistance levels for the sector and pointed to $3.65/70 as an interesting pivot for Corn.
Here’s an excerpt from that post (speaking generally about the Grains):
In order for any asset to bottom, they need to do two things:
1) Put in higher lows.
2) Break above notable resistance.
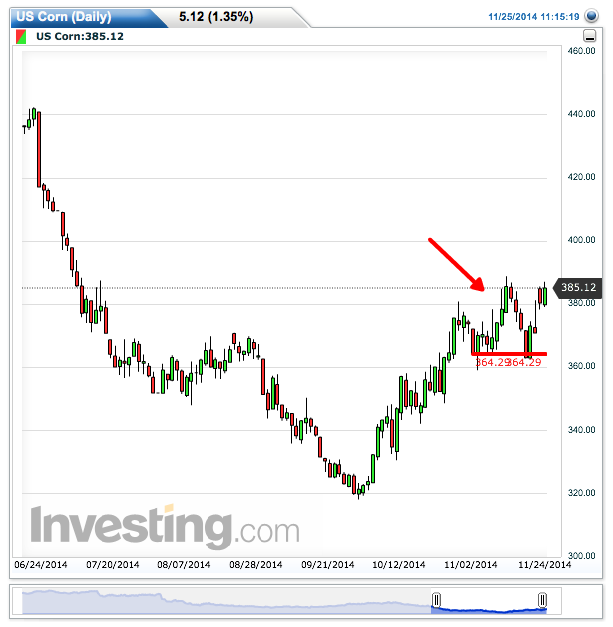
So far, so good for Corn prices. The chart below is intraday and shows the potential for a bottoming formation. Corn bulls would like to see Corn prices hold above the recent swing lows $3.60/62. Any meaningful pullback below $3.60 would put the near-term rally into question and require a higher low (preferably above $3.50, the other side of the bottoming formation) before evaluating again.
A determined breakout to new highs above $3.86 would be constructive and set up for higher prices.
Corn Futures – March 2015 (intraday)
Investors will be able to feel out winners and losers when the latest bounce across the commodities sector sees its first meaningful pullback. Those commodities that show relative strength may set up for the intermediate term. Investors can also track and trade the popular ETF, Teucrium Corn Fund (CORN). Thanks for reading.
Follow Andrew on Twitter: @andrewnyquist
No position in any of the mentioned securities at the time of publication. Any opinions expressed herein are solely those of the author, and do not in any way represent the views or opinions of any other person or entity.


