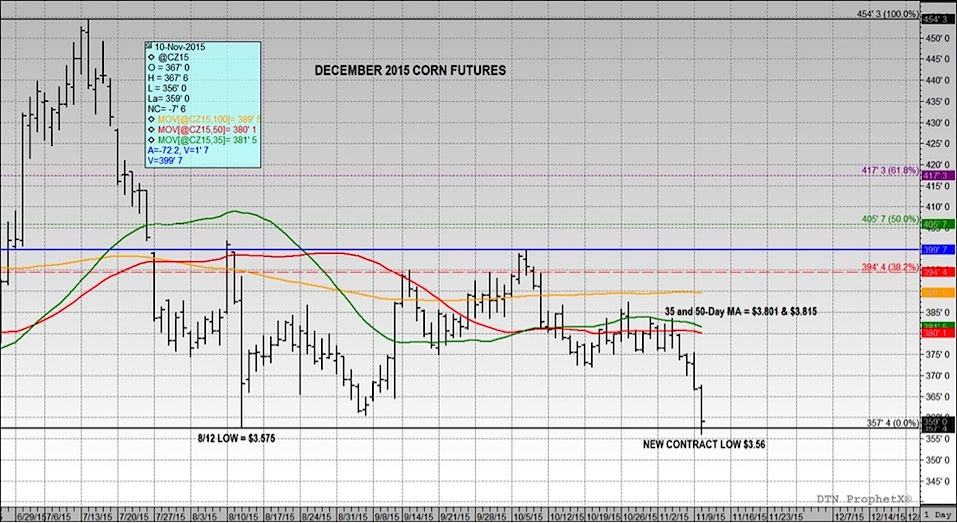
Judging by the immediate and aggressive sell-off in corn futures on Wednesday, just shortly after 11:00 a.m. CST, it was fairly easy to assess the market’s reaction to the USDA’s November 2015 WASDE report.
December Corn futures (CZ5) endured a sharp break back down to the August 12th contract low of $3.57 ½, eventually pushing through that level as the session progressed.
Let’s analyze some of the key S&D adjustments in the November WASDE report:
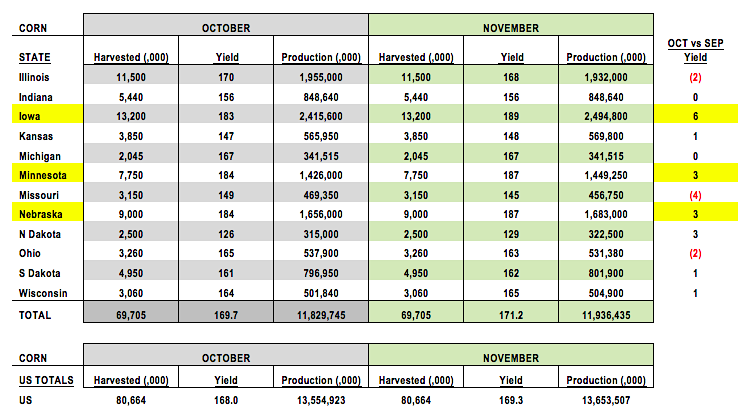
- US Corn Production: The US corn yield was raised to 169.3 bushels per acre versus 168.0 bpa in October and the average trade guess of 168.4 bpa. As a result of the yield increase, US corn production moved up to 13,654 million bushels, 99 million bushels higher than a month ago and 75 million bushels above the average trade guess. The big state-by-state winners in the November WASDE report were Iowa, Minnesota, and Nebraska. Iowa’s state corn yield jumped 6 bpa versus a month ago to a new record high of 189 bpa. Minnesota and Nebraska both enjoyed 3 bpa increases. Collectively those 3 states, all top 5 corn producers in the US, added 129.45 million bushels of corn production versus October. Illinois’s state corn yield was the most notable decrease, falling 2 bpa to 168 bpa.
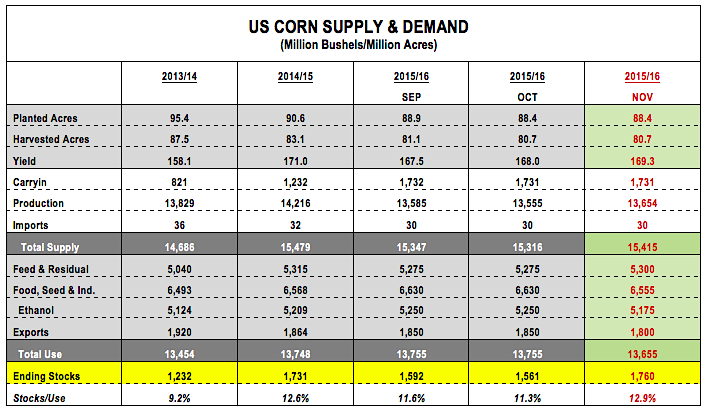
- US Corn Demand & Ending Stocks: There were several surprises on the demand side of the equation with the USDA choosing to lower US corn-ethanol demand 75 million bushels to 5,175 million. I alluded to the potential for a cut in my commentary last week; however I assumed the USDA would be patient given continued strong gasoline demand, as well as, US ethanol prices continuing to trade at a substantial discount to Brazil (inclusive of the freight spread from NYH/Houston to Santos and D5 versus D6 RIN valuation). The economics should favor US ethanol exports to Brazil by over 20-cents per gallon. That didn’t stop the USDA however from making a fairly sizable corn-ethanol usage reduction in the November WASDE report. The other notable demand decrease was to exports, totaling 50 million bushels, which was expected given the continued slow pace of US corn exports. The net result of the USDA’s S&D adjustments was a 199 million bushels increase to 2015/16 US corn ending stocks, which improved to 1,760 million bushels versus the average trade guess of 1,597 million.
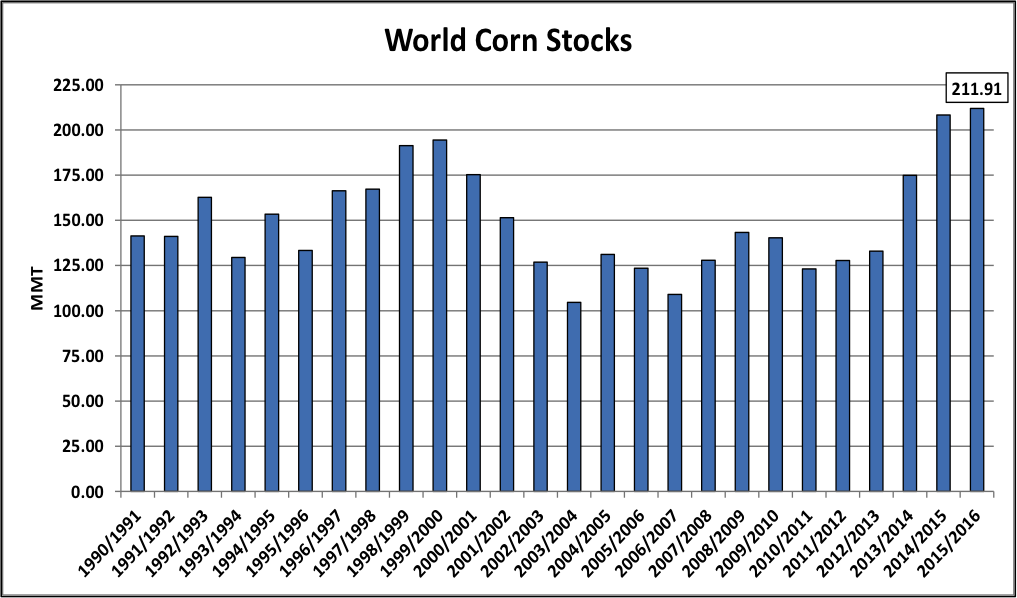
- World Corn Ending Stocks: I’d argue the biggest surprise in the entire report as it relates specifically to corn was the massive increase to 2015/16 World Corn Stocks. The USDA increased the 2015/16 World Corn Carryout by 24.1 MMT (948 million bushels) versus a month ago to 211.91 MMT, which compared to the average trade guess of 188.43 MMT. Was this a mistake? Apparently not. Upon further review I found 21 MMT of the stocks increase was attributed to the USDA cutting both 2013/14 and 2014/15 Chinese feed corn demand. This equated to China’s 2015/16 corn ending stocks exploding to 114.44 MMT versus 90.61 MMT in October. The Chinese corn carryout is now the largest the country has experienced since the 1999/2000 crop year. Clearly this explains all the measures China’s government has recently taken to reduce state grain reserves.
- Biggest Losers post November WASDE Report? Clearly this was not the report Corn Bulls were hoping for. The only positive as of today’s close is that December Corn futures (CZ5) managed to close back over the old contract low from August 12th after violating that level momentarily mid-morning, finishing this afternoon at $3.59 per bushel. However the other significant loser in the November WASDE report is the ethanol producer located in the Eastern Corn Belt. Total corn production in Illinois, Indiana, Ohio, and Missouri is now down 905.4 million bushels from a year ago. Lower production coupled with December corn futures trading well below $3.80 per bushel equates to the producer having virtually no incentive to sell his/her corn at this time. Ethanol plants will likely be forced to pay a significant basis premium, at least equal to the anticipated board carry to encourage any movement. This basis pattern could linger into September of 2016 if the corn market continues to trade under $4.00 in the prompt and the producer preserves adequate storage space and the cash necessary to be patient for a rally in corn prices. That said based on recent historical precedent, corn basis values of +40 to +50-over (cents per bushel above the spot futures prices) cannot be ruled out. With industry wide ethanol economics just slightly positive as it is, ethanol producers with significant corn basis exposure in the ECB will likely be disadvantaged to the rest of the industry for much of 2016.
Overall, there’s nothing in the November WASDE report to suggest that a harvest floor price has now been established. The World Corn Carryout increase alone provides fresh bearish ammunition for those looking for a new reason to sell corn. Furthermore, given the fact that as of last Friday’s Commitment of Traders report the Managed Money position in corn was still net long 24,765 contracts (as of the close on 11/3) it’s entirely possible that Money could shift to a net short position. Traders can’t forget that last year December corn futures did momentarily dip under $3.20 per bushel in early October.
December Corn Futures – Daily Chart
US Corn Yields & Production November vs October (state by state)
US Corn Supply & Demand (Sept-Nov YOY)
World Corn Stocks 1990 – 2015
Thanks for reading and have a great week.
Twitter: @MarcusLudtke
Any opinions expressed herein are solely those of the author, and do not in any way represent the views or opinions of any other person or entity.
Data References:
- USDA United States Department of Ag
- EIA Energy Information Association
- NASS National Agricultural Statistics Service

 Trading Near Top Of Price Range")


