Contrarian investing has always been a fascination of mine.
From the first time I read Humphrey Neill’s classic book The Art of Contrary Thinking, I’ve been watching magazine covers, newspaper headlines (above the fold, of course) and anything else that can suggest what the masses are thinking.
In case you’ve never tried it, being a contrarian is incredibly difficult. Michael Batnick described it perfectly on The Irrelevant Investor, saying, “By definition, a contrarian is going to be early, but in order to be successful, they can’t be too early. It’s in this small window that greatness exists.”
My own obsession with timing actually predates my introduction to the financial markets. As a trumpet player in the The Ohio State University Marching Band, I was taught, “To be early is to be on time. To be on time is to be late. To be late is to be cut.” The result of that mantra? Five years in the band, not late a single time.
The problem with being early in the markets? It can be painful. Very painful. Even if you end up being vindicated with a positive outcome. Best recent example? As I explained to my wife as we watched The Big Short together, “Sure they were right in the end, but look how miserable they were all along!”
So even though I’ve always been fascinated by indicators and techniques that I would group into the “contrarian” category- magazine covers, investor sentiment, divergences, DeMark indicators, etc.- for me it always comes down to price. And while the contrarian indicators would put something on my radar, a price reversal and subsequent follow-through is what tells me the move is for real.
This is what concerns me about something like the energy sector. Down 22% YTD vs. the S&P 500. All along the way, you could make contrarian arguments that it’s gone too far too fast, it’s oversold, bullish divergences, etc. etc. etc. But until the last couple weeks, when I noted a number of technical signals (trend line break, moving average break, higher high, higher low), it was just another chart in an established downtrend. Now it’s on the radar.
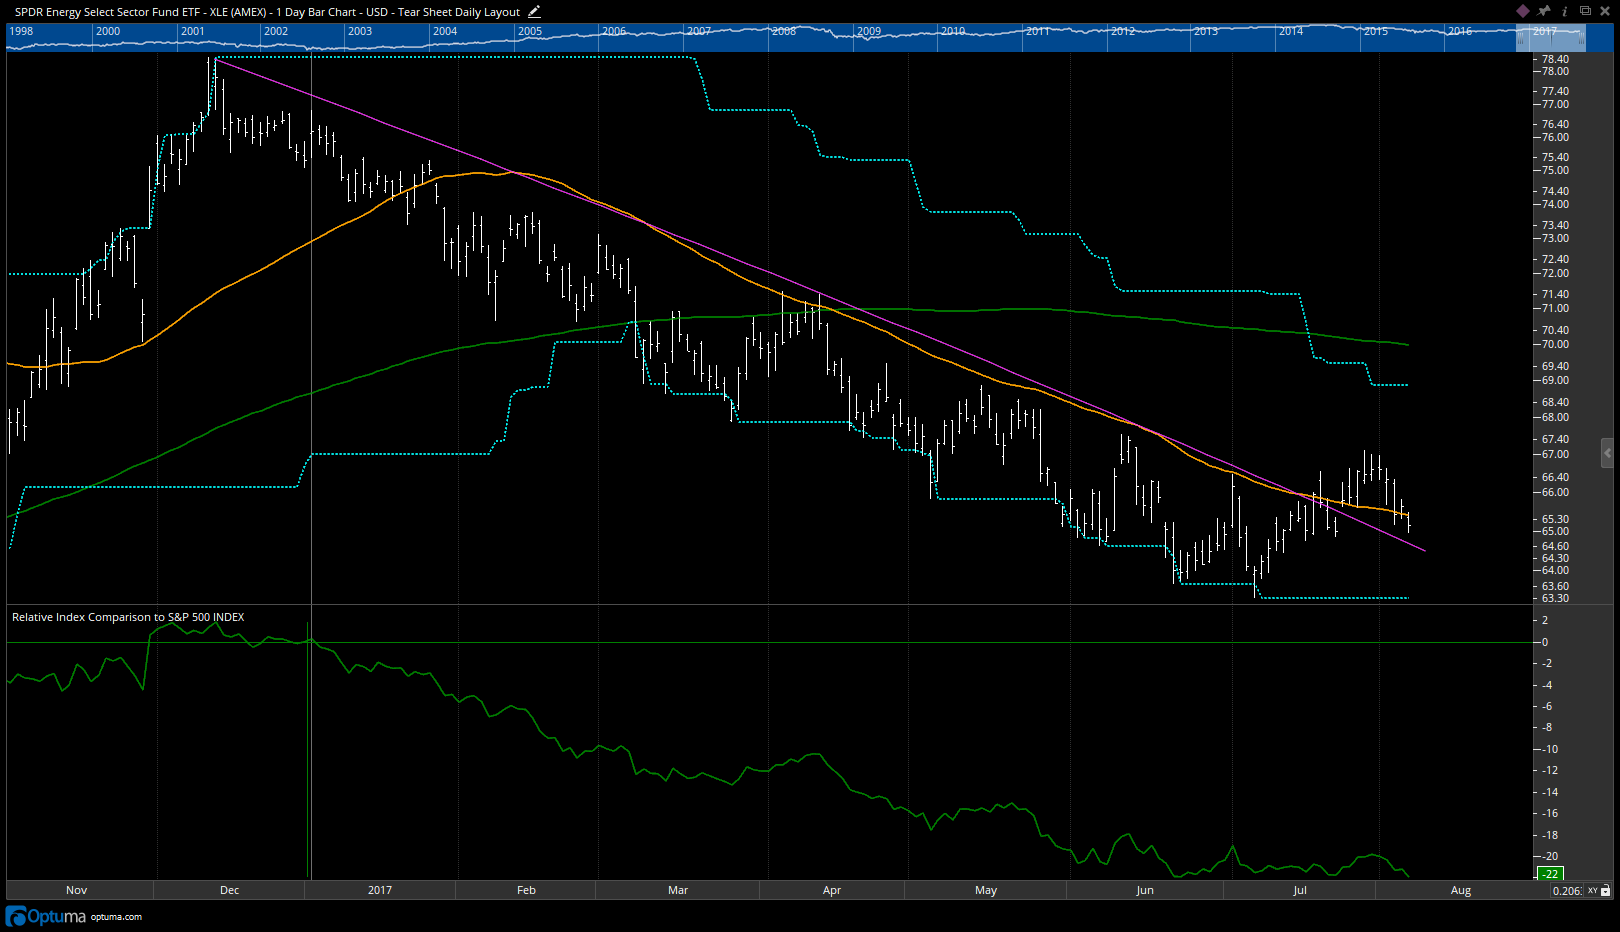
Source: Optuma
Stay tuned – there’s a lot more to come on the subject. And thanks for reading.
This post originally appeared on marketmisbehavior.com.
Twitter: @MktMisbehavior
The author does not have a position in mentioned securities at the time of publication. Any opinions expressed herein are solely those of the author, and do not in any way represent the views or opinions of any other person or entity.

: Showing Some Signs of Emerging Strength")

