On January 17, Alcoa Aluminum will report earnings.
As a main aluminum producer, Alcoa announced cost-cutting measures along with plans to curtail production at one Western Australian Refinery. But that is just one facility, and the company plans to continue to operate its port facilities located alongside the refinery. Plus, it will continue to import raw materials and export alumina produced at the Company’s Pinjarra Alumina Refinery.
Alcoa Corporation is a Pittsburgh-based industrial corporation. It is the
world’s eighth-largest producer of aluminum. Alcoa conducts operations in
10 countries.
Russia is the 3 rd largest producer of aluminum. India is number 2 and China is the world’s largest producer. I am interested in the metal mining space as well as industrial metals as an area that could play catch up in 2024, especially with any supply chain disruption.
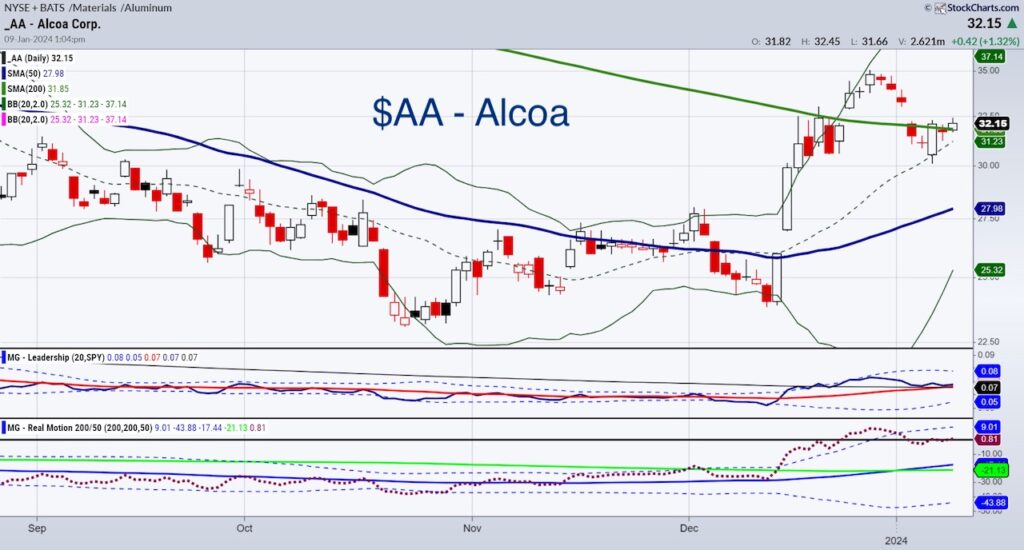
The daily chart of the company looks interesting. There is near-term support at 31.00 and major support at 30.00. And we really want to see the price regain 33.00.
Our Leadership indicator shows it slightly outperforming the SPY. Real Motion has momentum improving as it is back over the zero line.
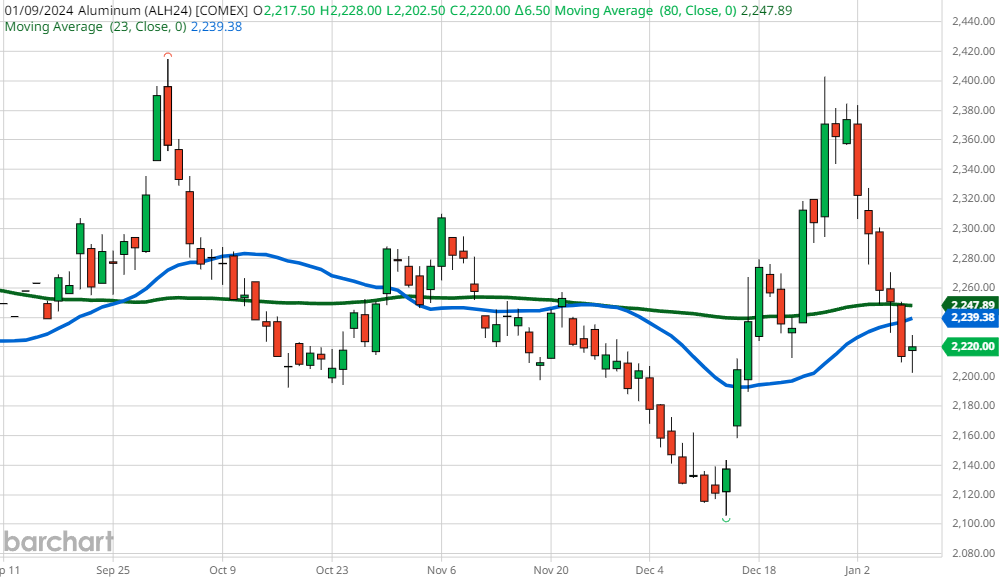
Plus, we cannot wait to see the January calendar ranges when they reset next week. Aluminum futures have a bit of different look.

The futures chart shows us a dramatic decline in price from December’s
peak.
2180 is the major support here. A move back over 2250 should send aluminum back up to test higher levels.
If this is a double top, then we will see the March contract fail 3280. However, it could also be a somewhat lopsided inverted head and shoulders with a neckline breakout over 2420.
I would not necessarily wait for that to enter this trade. I would, however, add to a long position if it gets up there.
Bottom line, AA and the futures chart are great tools to use to assess the strength of the industrial metals, economic growth, supply and demand and quite possibly, a re-ignition of inflation.
Twitter: @marketminute
The author may have a position in mentioned securities at the time of publication. Any opinions expressed herein are solely those of the author and do not represent the views or opinions of any other person or entity.


