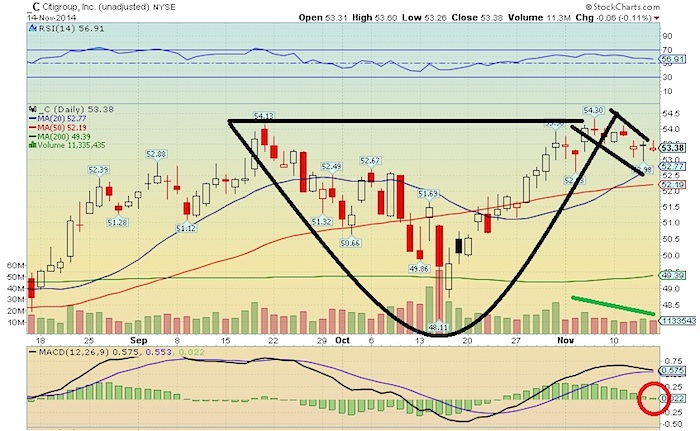
Today, I want to focus Citigroup (C) stock. And more specifically Citigroup stock chart. In the daily chart (below) you can see the classic looking cup and handle pattern setup brewing. The $54.00 – $54.50 level being the cup resistance line, then the handle/bull flag taking place in the last week or so. And notice how the handle is forming on relatively low volume, which I like to see.
One cautionary note for technical traders to watch: the MACD (moving average convergence/divergence) is about to have a negative crossover, which is a bearish signal.
Should Citigroup breakout above the cup line at $54.00 – 54.50, then momentum should pick up sharply, ideally negating the bearish MACD crossover. Recent candlesticks have been dojis (the open and close being nearly the same). This indicates indecision or a pause in trend, which is expected in the ‘handle’.
Citigroup Stock Chart – Cup and Handle Pattern?
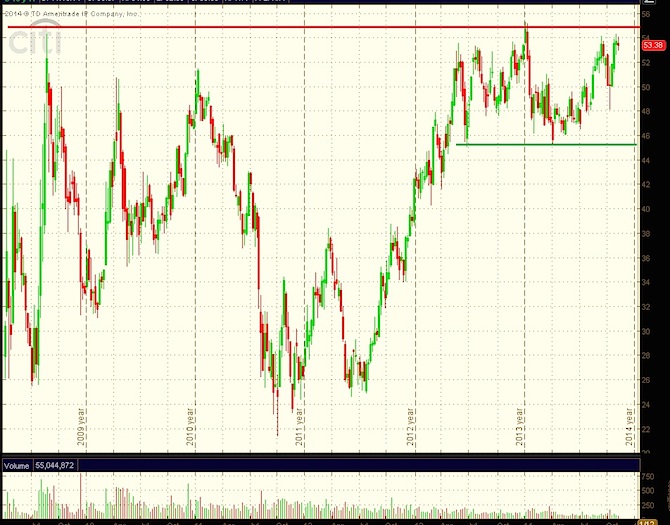
While many financial stocks are exhibiting cup and handle patterns following the October 15 bottom, the long-term chart is what separates Citigroup from the rest of the pack in the Financial Select Sector (XLF). I like how the $55 level has been prior resistance for many years. This means if the stock breaks this long-term resistance, then there is very little overhead supply/resistance to stop the stock. Overhead supply refers to a trading level in which there was heavy volume by price. Volume by price refers to the number of shares traded (volume) at a price range. The more volume at a certain price, the more this level should be support/resistance. Since there is no overhead supply since the 2007-2009 drop on Citigroup, I believe Citi can reach to the mid-60s once the mid-50s level is broken. The price objective is the measured move of the $45-55 range ($10) added on top of the $55 resistance = $65. I believe this $10 measured move supersedes the cup and handle price objective, which would be lower 60s.
You can see since early 2013, the $45 level has been support, while the $55 level has been resistance going back to 2009.
Citigroup (C) Long-Term Stock Price Chart
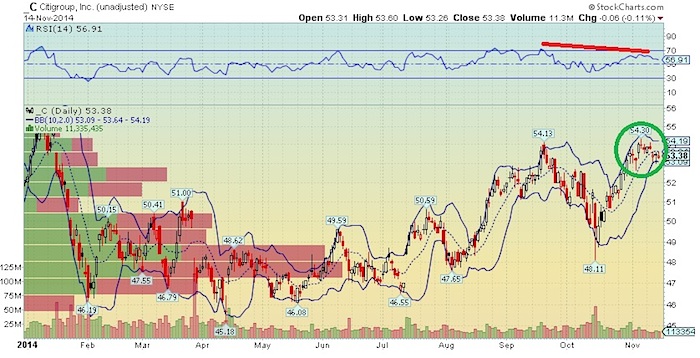
Below is a chart with ‘volume by price’. You can see the horizontal bars on the left showing the volume at specific price ranges. Above $55, there is very light volume, which means there is very limited overhead supply/resistance. I added the Bollinger Bands to the chart as well, but adjusted the default period from 20 days to 10 to show the very recent consolidation and pinching of the bands. When Bollinger Bands pinch to a narrow range, it indicates a potential important move in the near future. If the stock breaks above the $55 resistance level, this should coincide with a bullish break of the Bollinger Bands to the upside.
Citigroup (C) – Volume by Price Stock Chart
Thanks for reading.
Follow Mike on Twitter: @MikeZaccardi
No position in any of the mentioned securities at the time of publication. Any opinions expressed herein are solely those of the author, and do not in any way represent the views or opinions of any other person or entity.

: Worrisome to Broader Market?")

