 By Andrew Nyquist Late last week I received a request to look at Citigroup stock (Ticker symbol: C). As per usual, I started to dig in from a risk management perspective, highlighting key Citigroup stock support and resistance levels. But as I moved from Citigroup on across the sector, I noticed that many bank stocks, although trending from lower left to upper right, are at an important near-term juncture. With this in mind, I’ll be sure to do a chartology on the Financial Sector (XLF).
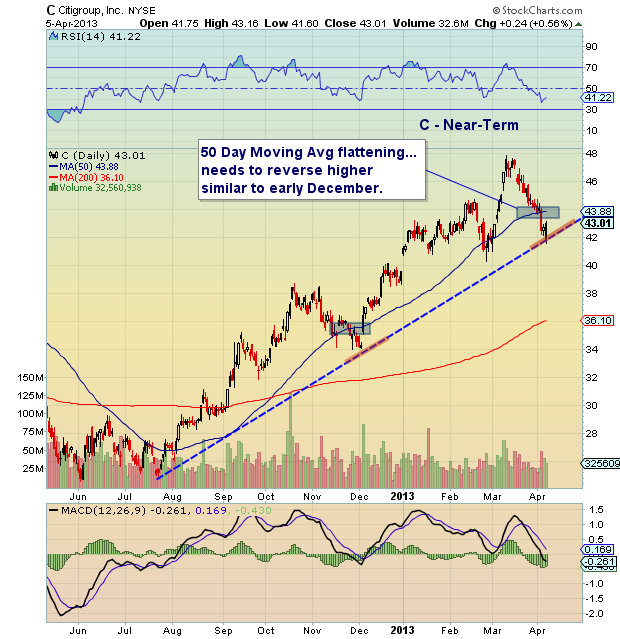
Below are 2 Citigroup stock charts looking at C from a near-term and long-term perspective. On the near-term chart, it is clear that Citigroup stock is nearing a make-it-or-break-it moment. The stock is sitting below its 50 day moving average, resting on its near-term uptrend line, and the 50 day moving average is starting to flatten out. This is a similar setup to late November/early December where the stock toyed with the uptrend line before pushing higher, pushing the 50 day moving average up with it. However, there are differences at this juncture. Note that Citigroup stock was 7 percent above its 200 day moving average in late November; it’s now 18 percent above that moving average. This may leave Citigroup stock vulnerable to underperformance, even if it does catch a nice bounce. As well, there is an open gap down at $39.56 that could be a magnet if the uptrend line breaks. In short, the trend is your friend, and two closes below the uptrend line would flash caution.
Citigroup Stock Technical Support – Near Term Chart
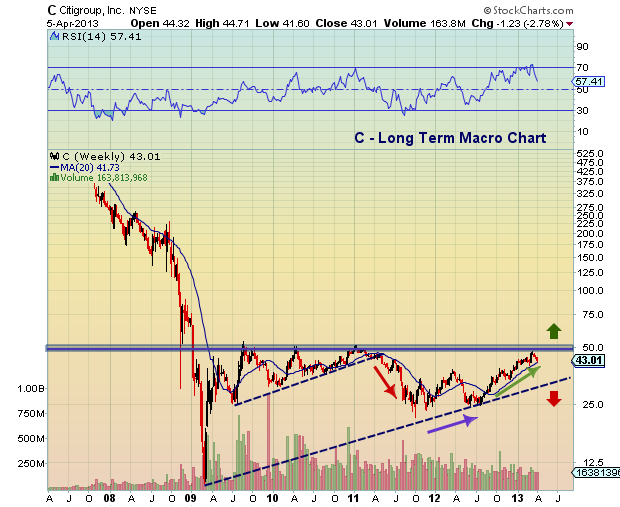
On the long-term chart, the 50 dollar level has provided major resistance. Over 2009 to 2011, Citigroup stock price bounced up against 50 dollars multiple times before breaking down and out of a bearish wedge formation in 2011. In 2013, the stock once again managed to work its way back to this key resistance level, before recently failing again. Longer-term Citigroup technical support resides at the four year uptrend line (around $32); but this would only come into play if another storm struck the market indices. And investors would have plenty of forewarning simply by monitoring key support levels from the inside out (from a near-term lens to a longer-term one). Other Citigroup technical support levels reside around $39.56 (open gap), $38 (October/November highs), and $36 (200 day moving average).
C Technical Support and Resistance Levels – Long Term Chart
 Trade safe, trade disciplined.
Twitter: @andrewnyquist and @seeitmarket
No position in any of the mentioned securities at the time of publication.
: Worrisome to Broader Market?")

: Important Breakout Retest")
