The Shanghai Composite rallied 5.7% in Monday’s trading session as China’s state-run Securities Journal noted the importance of a healthy bull market to the Chinese economy.
This news sent both the iShares China Large Cap ETF NYSEARCA: FXI and Baidu NASDAQ: BIDU soaring in the U.S. session.
As of 1:30 PM ET, FXI is up 8.7% and BIDU is up 6.9%.
In this blog post, we will review our weekly cycle analysis for both FXI and BIDU.
iShares China Large Cap ETF (FXI) Weekly Chart
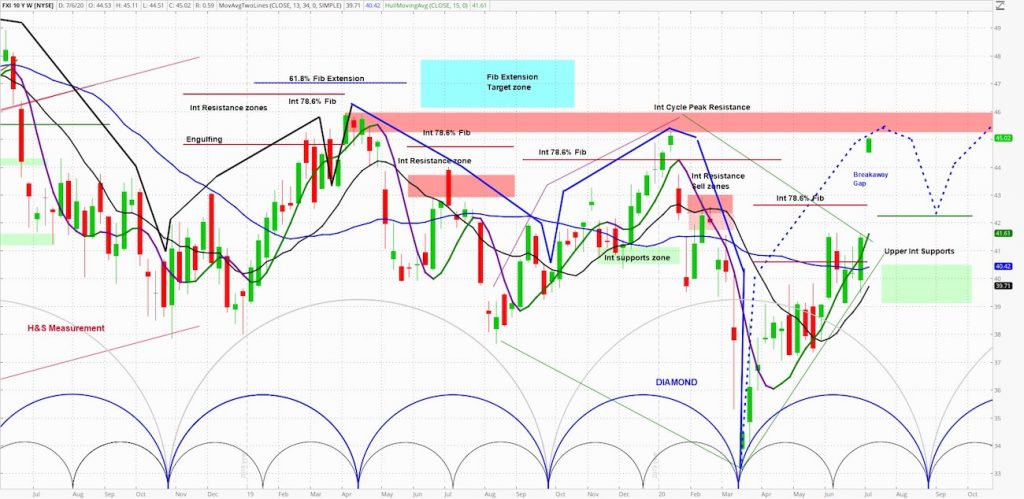
askSlim Technical Briefing:
The weekly analysis suggests that FXI is in a positively configured cycle.
The next projected low is due in the middle-to-end of August. Weekly momentum is firmly positive.
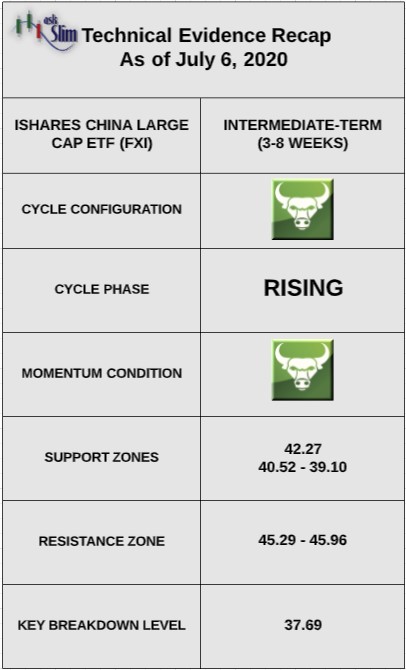
On the upside, there are prior cycle high resistances from 45.29 – 45.96.
On the downside, there is a rising intermediate-term support at 42.27 followed by another zone of support from 40.52 – 39.10. For the bears to regain control of the intermediate-term, we would need to see a weekly close back below 37.69.
askSlim Sum of the Evidence:
FXI has a bullish weekly cycle pattern with positive momentum. Given these conditions, we would expect downside to be limited to the rising intermediate-term supports beginning at 42.
Baidu (BIDU) Weekly Chart
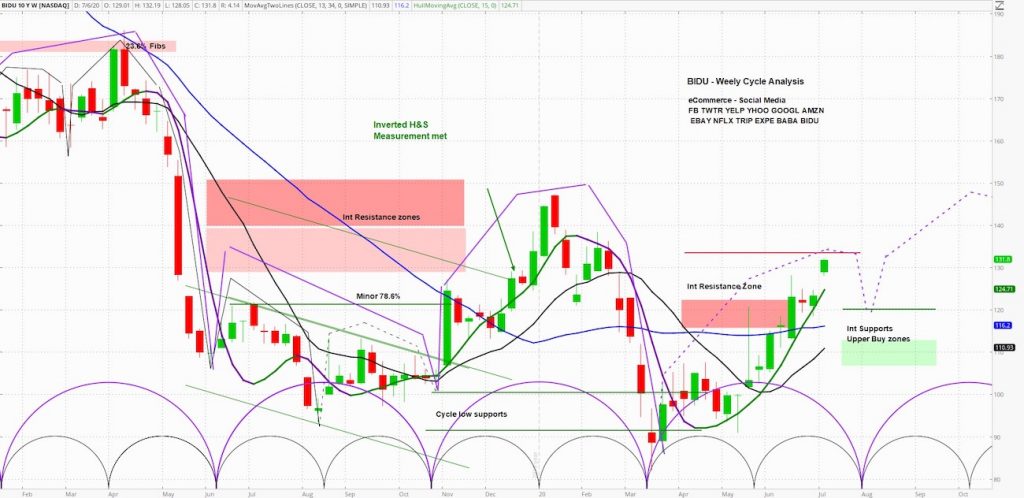
askSlim Technical Briefing:
The weekly cycle analysis suggests that BIDU is forming an important base.
The next projected intermediate-term low is due in early-to-mid August. Weekly momentum is positive.
On the upside, there is an intermediate-term Fibonacci resistance at 133.39.
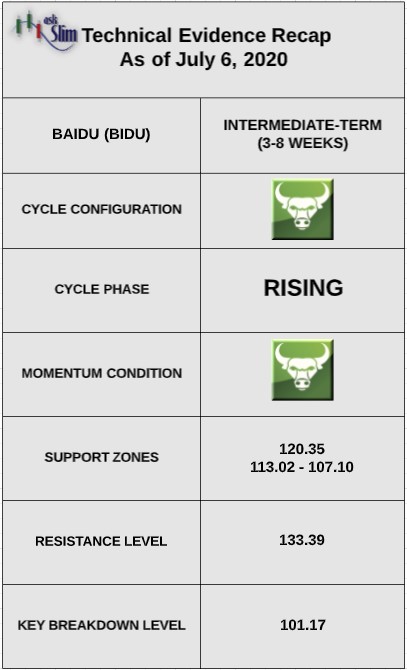
On the downside, there is a rising intermediate-term support at 120.35 followed by another zone of support from 113.02 – 107.10.
For the bears to regain control of the intermediate-term, we would need to see a weekly close back below 101.17.
askSlim Sum of the Evidence:
BIDU has a bullish weekly cycle pattern with positive momentum. Given these conditions, we would expect any downside to be limited to the rising intermediate-term supports beginning at 120.
Interested in askSlim?
Get professional grade technical analysis, trader education and trade planning tools at askSlim.com. Write to matt@askslim.com and mention See It Market in your email for special askSlim membership trial offers!
Twitter: @askslim
Any opinions expressed herein are solely those of the author, and do not in any way represent the views or opinions of any other person or entity.


