It’s been over 15 years since China’s equity market was in a long-term bullish position.
Now don’t get me wrong, there have been plenty of medium term trends to trade and make money but the long-term chart for the major China ETF (FXI) has traded sideways since the 2009 low.
So where are we now?
Today we look at the “monthly” chart of FXI to provide an update.
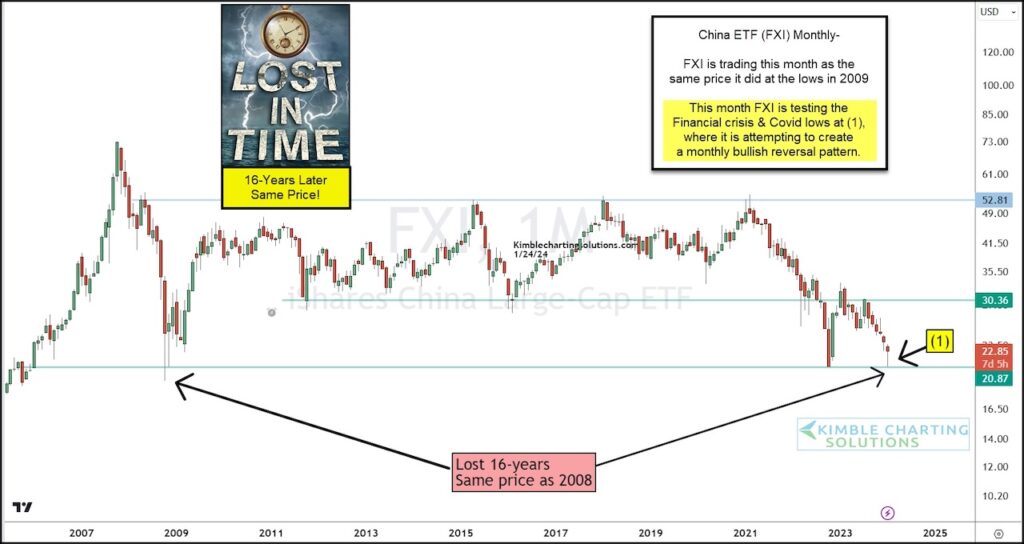
As you can see, FXI has traded in a 15 year price channel (as well as a 10-year intra-channel). And as we near the end of the month, FXI is attempting to create a bullish reversal pattern off the financial crisis & covid lows at (1).
Could a triple bottom be taking place in this out of favor country? China bulls sure hope so. Stay tuned!
$FXI China ETF “monthly” Chart
Note that KimbleCharting is offering a 2 week Free trial to See It Market readers. Just send me an email to services@kimblechartingsolutions.com for details to get set up.
Twitter: @KimbleCharting
The author may have a position in mentioned securities. Any opinions expressed herein are solely those of the author, and do not in any way represent the views or opinions of any other person or entity.


