 By Andrew Nyquist
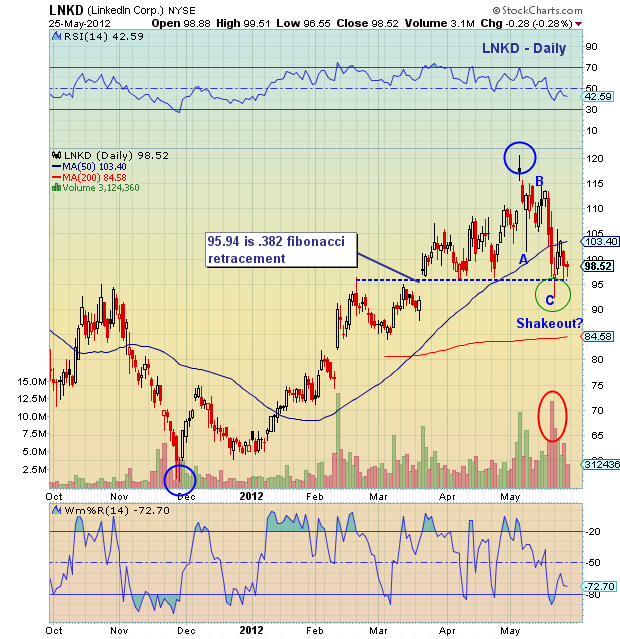
Last weekend I did a chart showing the importance of the 95-96 support area for LinkedIn (LNKD) — this area represents lateral support, an A-B-C measured move, as well as .382 fib retracement. Sure enough, early this week price briefly pierced 95-96 before reversing higher to 105, leaving a long tail.
The question now is, was this just a short-term shakeout for a “trade” higher, or will it lead to higher yet? Considering the swift, heavy drop, it’s important to define risk. And watch the recent lows.
See Annotated Chart Below.
LinkedIn (LNKD) annotated daily stock chart with technical analysis overlay as of May 25, 2012. Price support and resistance Levels. Technical Analysis. Fibonacci Retracement Levels. Measured ABC move. LNKD Stock.
———————————————————
Twitter: @andrewnyquist and @seeitmarket Facebook: See It Market
No position in any of the securities mentioned at the time of publication.
Any opinions expressed herein are solely those of the author, and do not in any way represent the views or opinions of his employer or any other person or entity.


