 By Andrew Nyquist
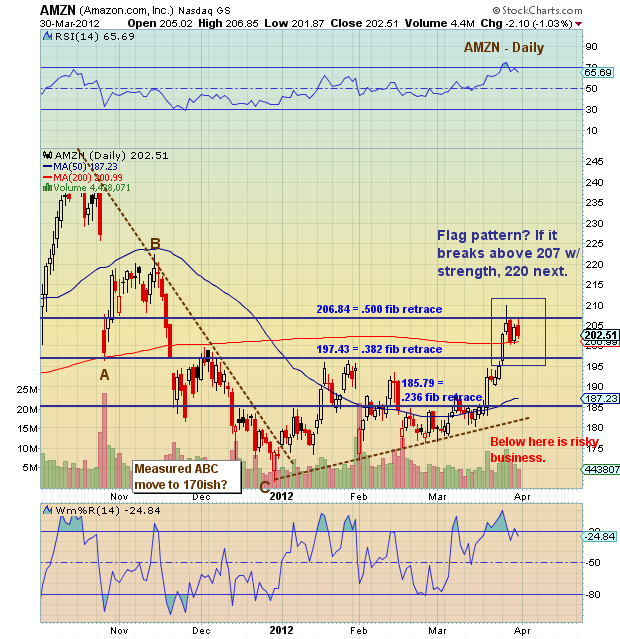
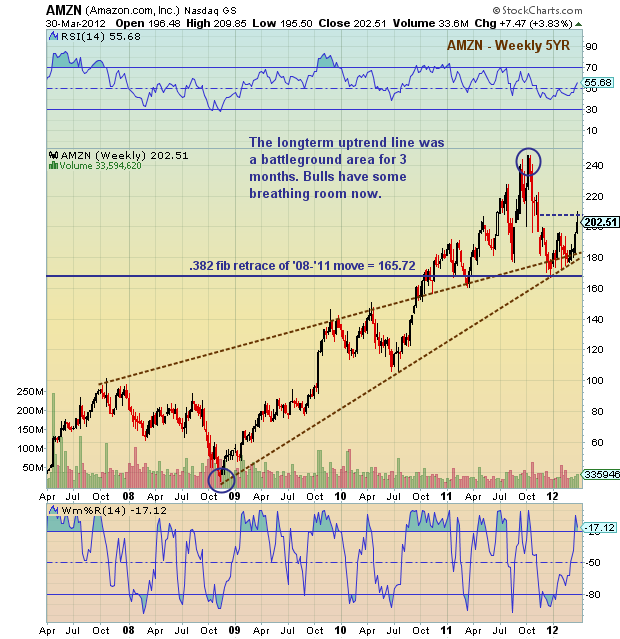
After clinging to long term support for over 2 months, Amazon (AMZN) was in do or die mode. As early as February, pundits were calling for an Amazon (AMZN) nose dive. And although it looked tense, there were a few important technical items that needed to be understood before writing the stock off, or even shorting it:
1) Long term trend lines rarely break upon first approach — and, as such, it stayed in tact. So there was no need to go short for any longer than a day or two quick hitter trade.
2) The move from 246 to 166 was a measured move. Furthermore, the .382 fib lined up with the bottom of the measured move. This supports the theory of a hold and bounce.
3) After hitting RSI 30 on the initial drop, the RSI held above 30 throughout, and recently exploded higher.
 This isn’t as much a bullish blog about Amazon as it is about respecting the technical setup. If the technicals start to break down, then caution is warranted. And furthermore, if the long term trend line breaks, then it’s time to get out of long and possibly short. Have a great day.
Amazon (AMZN) annotated daily and weekly stock charts with technical analysis overlay as of March 30, 2012. Price Support and Resistance Levels with fibonacci retracements. AMZN trading setup.
———————————————————
Your comments and emails are welcome. Readers can contact me directly at andrew@seeitmarket.com.
Twitter: @andrewnyquist and @seeitmarket Facebook: See It Market
No positions in any of the securities mentioned at the time of publication.
Any opinions expressed herein are solely those of the author, and do not in any way represent the views or opinions of his employer or any other person or entity.


