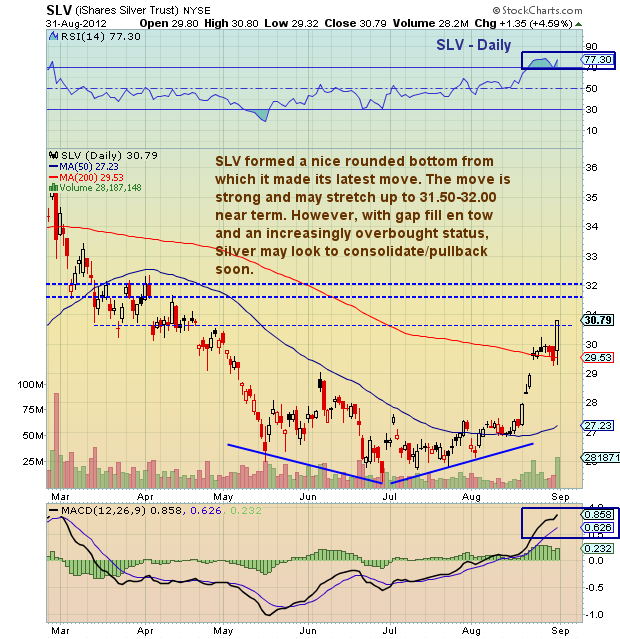
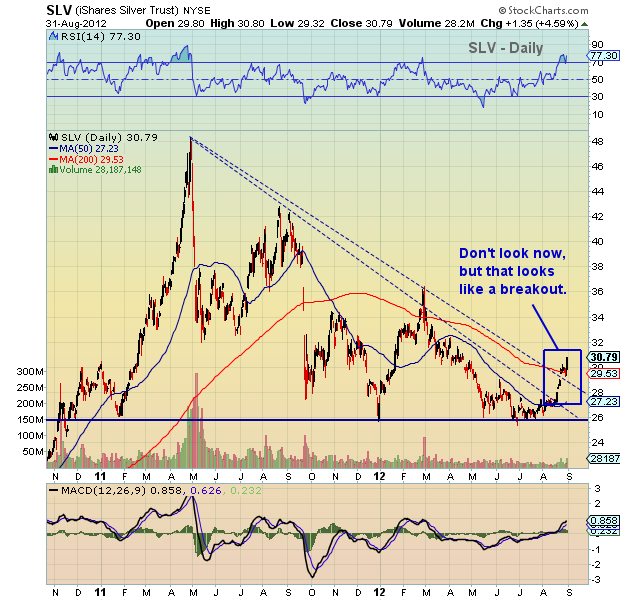
 Silver (SLV) rocketed higher pushing to the 30.75 resistance level that I mentioned in my previous technical update. However, considering the way it burst higher, there is a good chance it may look to extend gains a bit further before consolidating/pulling back.
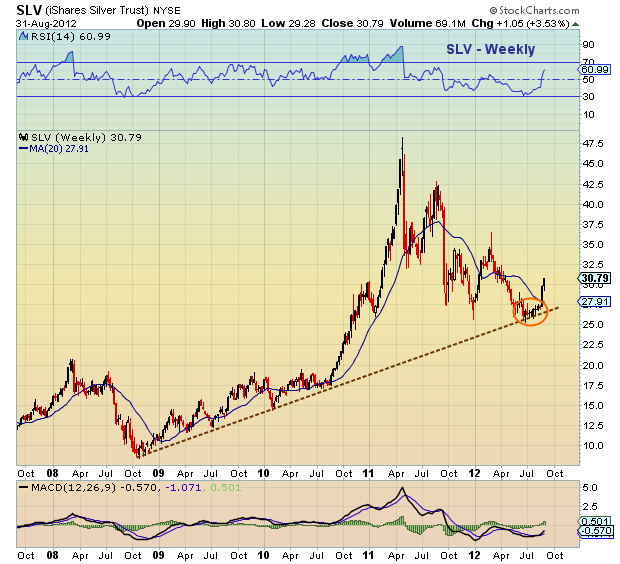
See daily short and intermediate term charts below, as well as a long term chart with trend line.
More charts found here.
Silver iShares (SLV) charts with technical analysis overlay as of August 31, 2012. SLV Price support and resistance levels with technical analysis. SLV chart with trend lines and technical support levels. Silver – precious metals.
———————————————————
Twitter: @andrewnyquist and @seeitmarket Facebook: See It Market
No position in any of the securities mentioned at the time of publication.
Any opinions expressed herein are solely those of the author, and do not in any way represent the views or opinions of his employer or any other person or entity.


