 By Andrew Nyquist
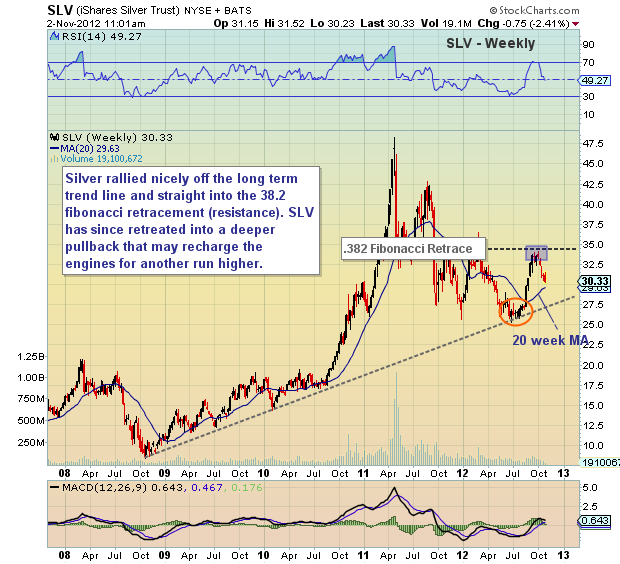
The past few weeks have definitely been heavy for Silver (SLV). Since hitting the 38.2 percent Fibonacci retracement level, silver has been hit with nothing but downward pressure.
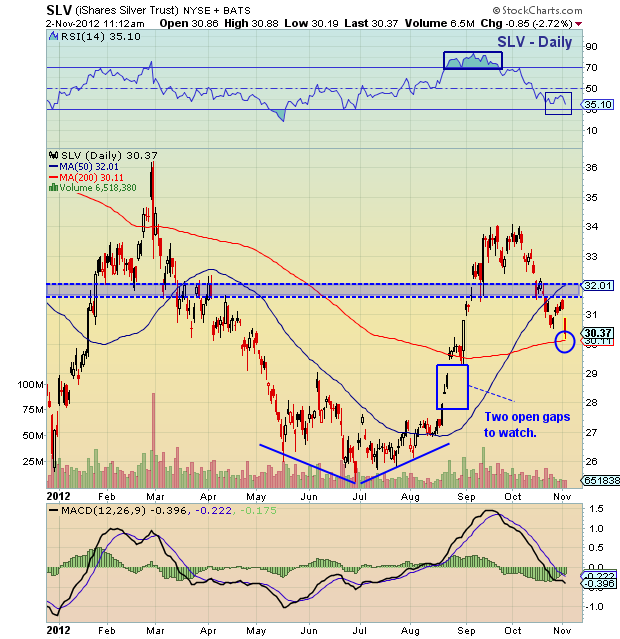
On the daily bar chart, which requires a tighter lens/timeframe, SLV is nearing important support around the 200 day moving average (30.11). And on the weekly bar chart (a bit wider lens), the etf is nearing its 20 week moving average (29.63). This is the 50 cent band that bulls should be watching near term. If these levels fail, then SLV will likely head to one or both gap-fill levels around 29 and 28.
For recent blogs on SLV and its stealth correction, click here.
Trade safe, trade disciplined.
More charts found here.
Silver (SLV) technical charts as of Novemeber 2, 2012. SLV charts with technical analysis and price targets for November. Precious metals sector and silver.
———————————————————
Twitter: @andrewnyquist and @seeitmarket Facebook: See It Market
No position in any of the securities mentioned at the time of publication.
Any opinions expressed herein are solely those of the author, and do not in any way represent the views or opinions of his employer or any other person or entity.


