 By Andrew Nyquist
Since its IPO, Groupon (GRPN) has basically been a lead weight. Investors have been beaten to a pulp and many are wondering if this is a straight to zero stock. Yep, lots of negativity surrounding the stock. But, it was this negativity that caught my attention last month when Groupon announced earnings and the stock subsequently plunged deeper into the abyss – sub 5 bucks.
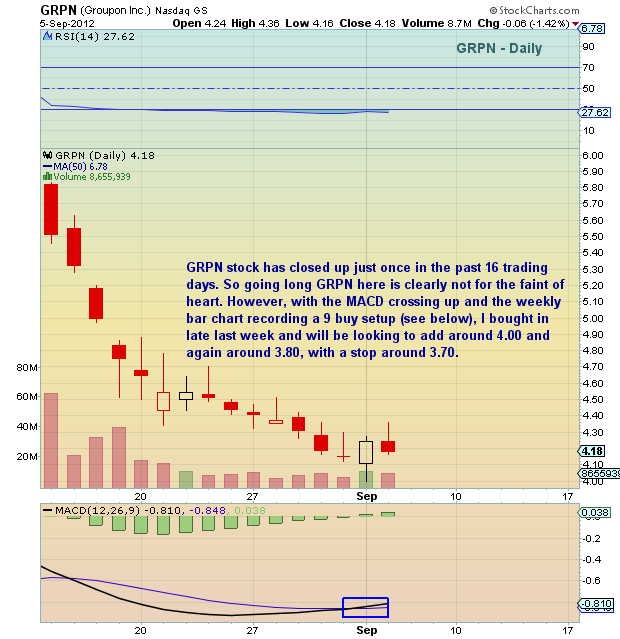
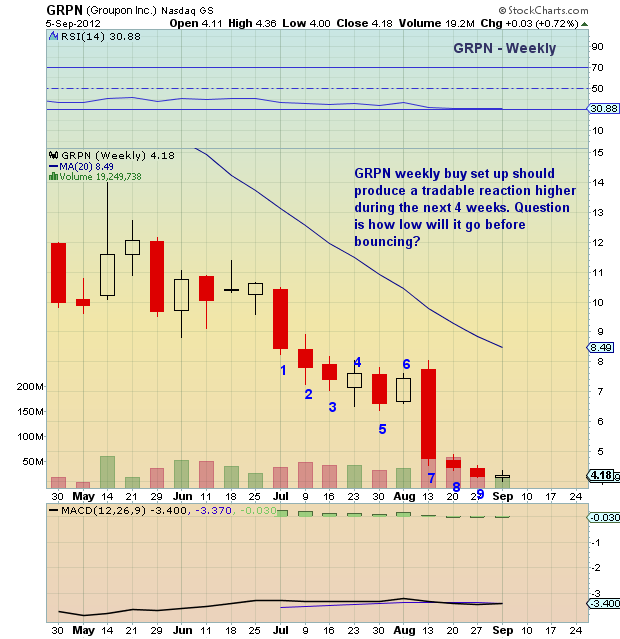
Now, I’m no fan of jumping in front of oncoming traffic, so I turned to the charts for some good old fashioned technical analysis. At the time, I noticed the MACD on the daily chart was crossing down (bearish) and the RSI was pushing sub-50 (also bearish). As well, the weekly chart was on bar 7 of a DeMark weekly buy setup (7 being a momentum bar) — and it still needed two more weekly closes lower than the close 4 weeks prior. In summary, patience was still needed.
So here we are a few weeks later… the stock has recorded the weekly buy setup and the MACD on the daily chart is now turning higher. I went long late last week and I’m nearing a 1/2 position size. Ideally, I’d like to buy more around $4.00 and again nearing $3.80. But reality tells me that I’ll have to re-evaluate this position daily and trade what’s in front of me within the context of the weekly setup. Note that trading around the core is a good way to dollar cost average. Again, this is a trade.
I’ll provide a chartology update should the stock push considerably higher or lower over the coming days/weeks. Note that this stock carries considerable risk as a sub $5 stock, so check your risk profile if considering.
More charts found here.
Groupon (GRPN) stock charts as of September 5, 2012. GRPN technical charts with DeMark analysis. GRPN weekly DeMark buy setup. Groupon all time lows.
———————————————————
Twitter: @andrewnyquist and @seeitmarket Facebook: See It Market
The author was long Groupon (GRPN) stock at the time of publication.
Any opinions expressed herein are solely those of the author, and do not in any way represent the views or opinions of his employer or any other person or entity.


