 By Andrew Nyquist
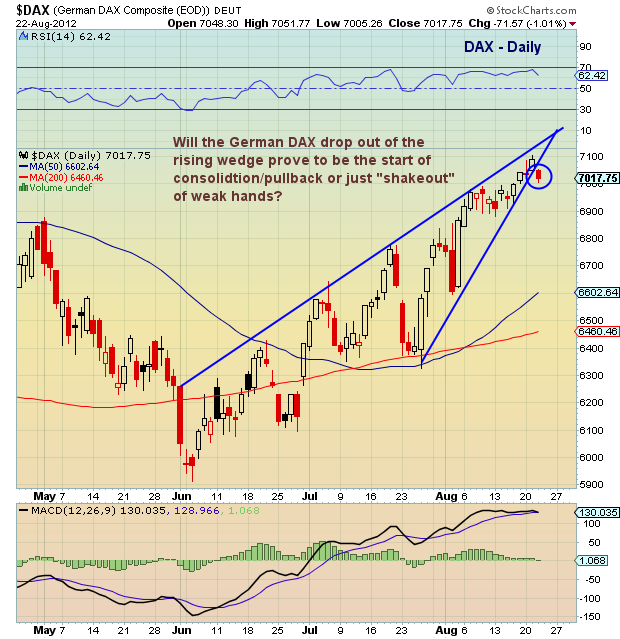
The German DAX composite index has been on a nice run of late… aided in part by Mario Draghi’s commitment to do “whatever it takes” to protect the Euro zone. That said, yesterday’s selloff may have pushed the index out of a rising wedge pattern. Question is: Will this prove to be a “shakeout” (with the index swinging back through the uptrend line to new highs) or the start of some consolidation and back and fill. Note it’s up in the overnight session – around 7075 as I type (not shown in EOD chart below).
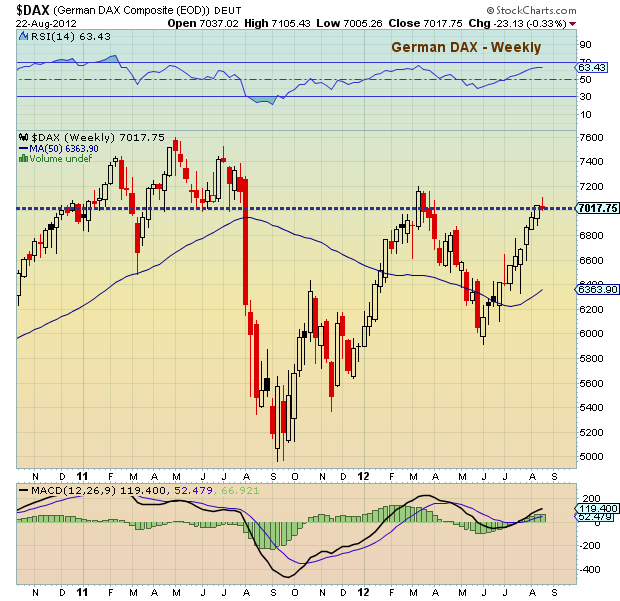
On the weekly chart, note that the DAX is hanging around the 7000 – 7200 resistance band. As well, the weekly bar chart is on bar 9 of a DeMark sell setup which could hint at some late August/early September weakness.

But first and foremost, all eyes are on Mario Draghi and the ECB. Will he swoop in with more details on a bond buying rescue plan rescue plan? And will Germany offer its full support? And lastly, how will the markets react. Inquiring minds want to know…
More charts found here.
German DAX stock market charts as of August 22, 2012. DAX charts with trend lines and technical support levels. German stock market. DAX technical analysis.
———————————————————
Twitter: @andrewnyquist and @seeitmarket Facebook: See It Market
No position in any of the securities mentioned at the time of publication.
Any opinions expressed herein are solely those of the author, and do not in any way represent the views or opinions of his employer or any other person or entity.


