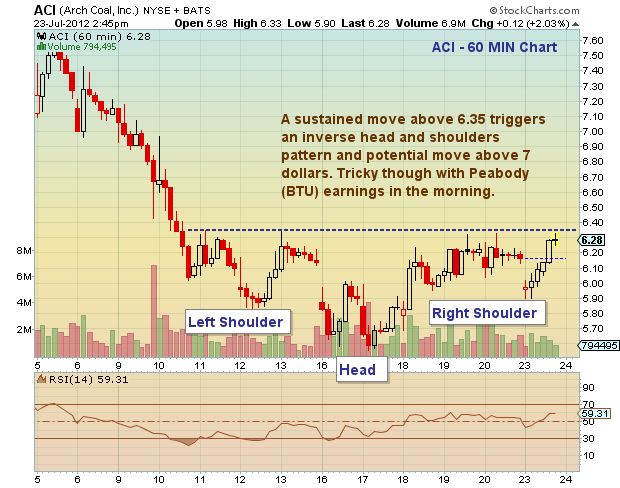
 Last week, I posted a series of Arch Coal (ACI) charts – hourly, daily, weekly. As I noted in the hourly chart, there is an inverse head and shoulders pattern that is still in tact and will be triggered with a sustained move over 6.35 — careful though, as the stock hemmed and hawed above/below this line today AND Peabody Energy (BTU) reports earnings tomorrow. That said, a move above 6.35 would likely target 7.00 and possibly higher.
Due to the current coal landscape, this stock carries significant risk. Always remember to define your risk (stops).
Arch Coal (ACI) stock chart with price support and resistance levels and technical analysis as of July 23, 2012. ACI inverse head and shoulders technical pattern. Arch Coal stock with important price levels and targets.
———————————————————
Twitter: @andrewnyquist and @seeitmarket Facebook: See It Market
Position in ACI.
Any opinions expressed herein are solely those of the author, and do not in any way represent the views or opinions of his employer or any other person or entity.


