 By Andrew Nyquist
After hanging around and pinning to 700 with last Friday’s OpEx, Apple (AAPL) has dropped roughly 4 percent in 2 days. The bulls are in dip buying mode and trying to game the opportunity, while bears are looking for ways to take out support levels.
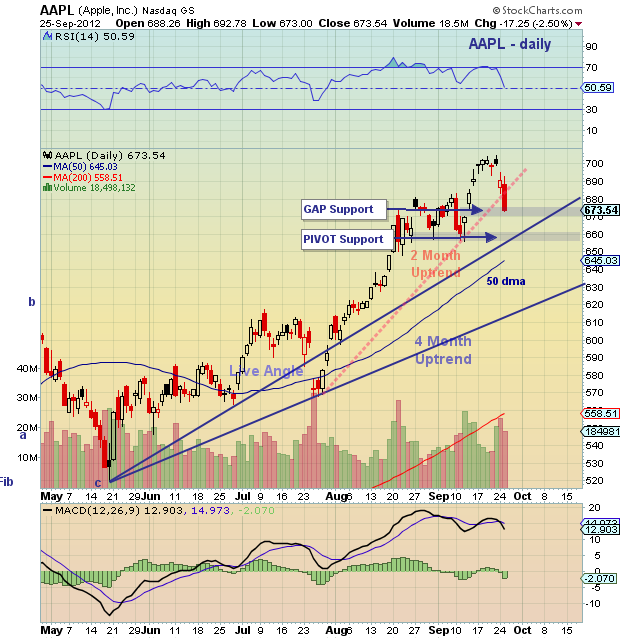
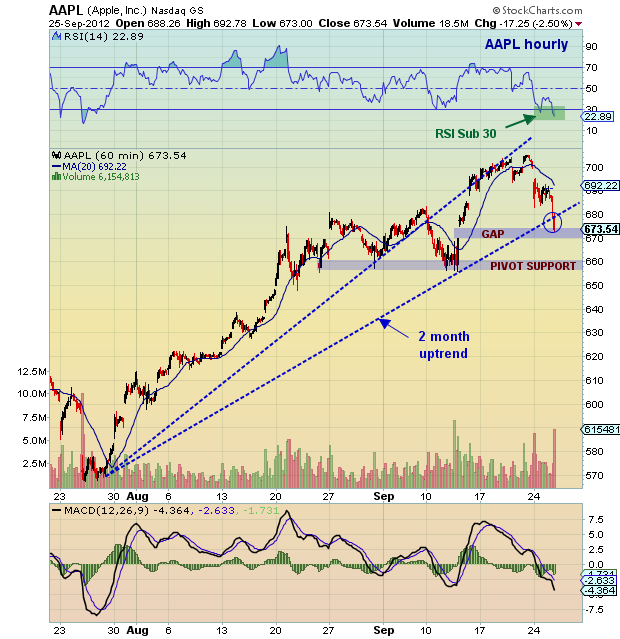
In an effort to better understand the near term technical picture for Apple’s stock, I took a look at both the daily bar chart and hourly; the daily bar chart highlighting the move from the bottom in May, and the hourly bar chart highlighting the move from the late July pivot low. It’s notable that the hourly bar chart is quite oversold sporting a sub-30 RSI (22). This seems to be indicating that a bounce is likely in the next day or two. Although gap fill support around 670 cannot be ruled out, stronger support comes into play as price nears 660. And this could be a battleground area.
Trade safe, trade disciplined.
More Charts here.
Apple, Inc. (AAPL) stock charts as of September 25, 2012. AAPL technical support and resistance levels with trend lines and open gaps. AAPL technical analysis.
———————————————————
Twitter: @andrewnyquist and @seeitmarket Facebook: See It Market
No position in any of the securities mentioned at the time of publication.
Any opinions expressed herein are solely those of the author, and do not in any way represent the views or opinions of his employer or any other person or entity.


