 By now, most market participants have taken note of the US Dollar rally. In the early stages of the rally, it was simply a slow rise. However, that has given way to a rapid accent, seeing the US Dollar Index jump from below 80 to 84.75 in just over two months. And the recent surge higher in the Dollar seems to be adding some volatility to the Emerging Markets complex.
In the chart below, I have pulled together the ratio of the Emerging Markets ETF (EEM) to the S&P 500 ETF (SPY) and charted that against the US Dollar (green thick line). What’s interesting is that the Emerging Markets have significantly underperformed US Equities (represented by SPY) over the past month or so. And during that time, the Dollar has surged higher.
EEM:SPY vs US Dollar – Daily Chart
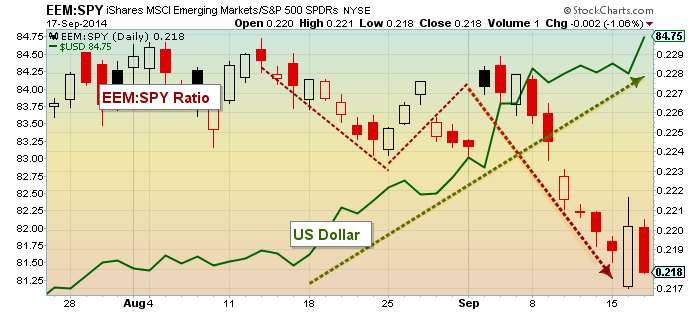
The US Dollar’s push higher today came courtesy of the market’s reaction to today’s Fed policy announcement earlier today. And, as you can see, Emerging Markets logged yet another day of underperformance.
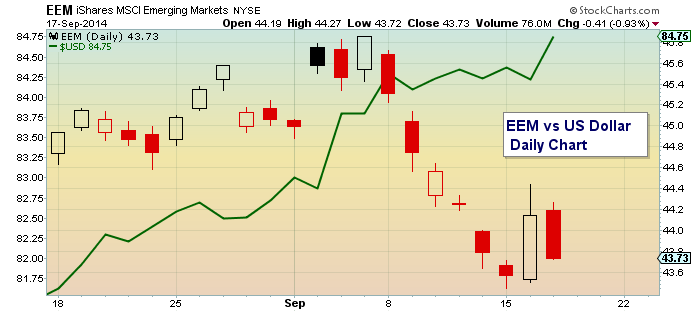
On a technical basis, EEM is nearing key support. Earlier this week, I wrote a research note about EEM’s underperformance and highlighted $43 as a key support level. Below is one more chart for reference, showing the price of EEM straight up against the US Dollar.
EEM vs US Dollar Chart
Active investors will want to monitor the US Dollar to see if the strength today is simply reactionary icing on the cake that will give way to a pullback, or if the Dollar is setting up for another run higher. EEM will be watching too.
No position in any of the mentioned securities at the time of publication. Any opinions expressed herein are solely those of the author, and do not in any way represent the views or opinions of any other person or entity.


