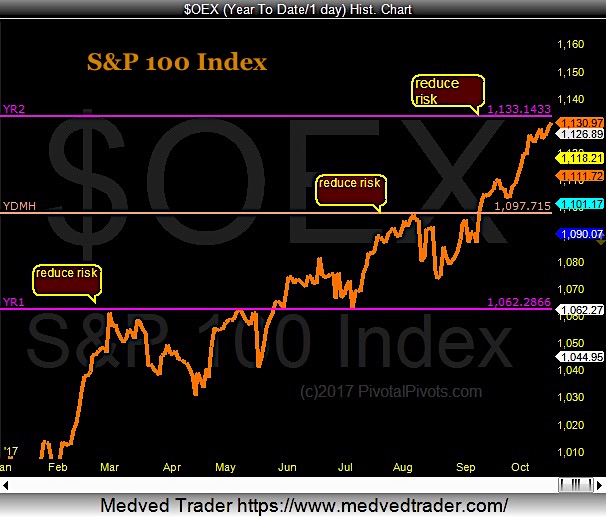
The S&P 100 Index (INDEXSP:SP100) touched its Yearly Yr2 Pivot around 1133 on Wednesday… and its testing it yet again today (at the time of this writing, it’s at 1133.40).
What’s so special about the Yearly Yr2 pivot? Well, it usually produces a market pullback or correction.
For more on this, check out my latest post here on See It Market highlighting the Yr2 pivot across all the major stock market indexes and showing how it has historically stopped strong advances… and even bull markets: 10 Years Later… Is The Stock Market Topping Again?
Now take a look at the S&P 100 (OEX) chart below… you can see that each of the yearly pivots produced a pullback this year on the S&P 100.
My experience with pivots tells me that there’s pretty good odds it will again at the Yearly Yr2 pivot.
In my humble opinion, the risk/reward here is not good… at least over the near-term.
S&P 100 Index – Yearly Pivots
Thanks for reading.
Twitter: @Pivotal_Pivots
The author may have a position in mentioned securities at the time of publication. Any opinions expressed herein are solely those of the author, and do not in any way represent the views or opinions of any other person or entity.

: Showing Some Signs of Emerging Strength")
