 Since the 2009 bottom, US equities have outperformed most of their global peers. One of the underperforming laggards has been China. And using ETFs as comparables, the ishares China ETF (FXI) simply moved sideways in a wide range for most of the past five years.
That is, until 2015.
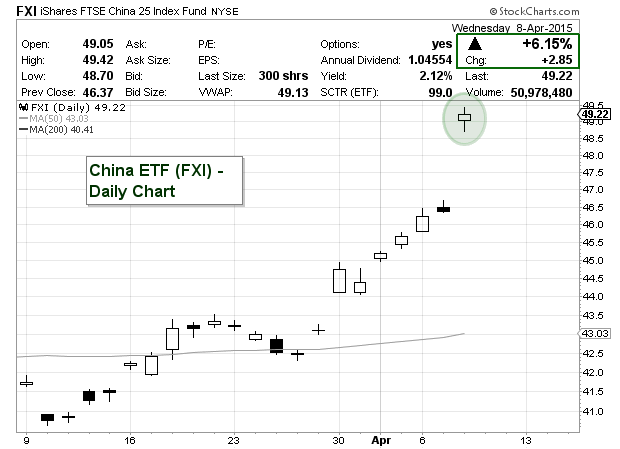
Since last spring, the China ETF has been on a tear, rising over 50 percent. And that rally found sunny skies this year, as FXI busted out to new 7 year highs. And when I say busted out, I mean jailbreak style. FXI has jumped nearly 16 percent in the past 8 trading sessions. And a big chunk of that was gained today (6.15%). See the charts below.
iShares China ETF (FXI) Daily Chart
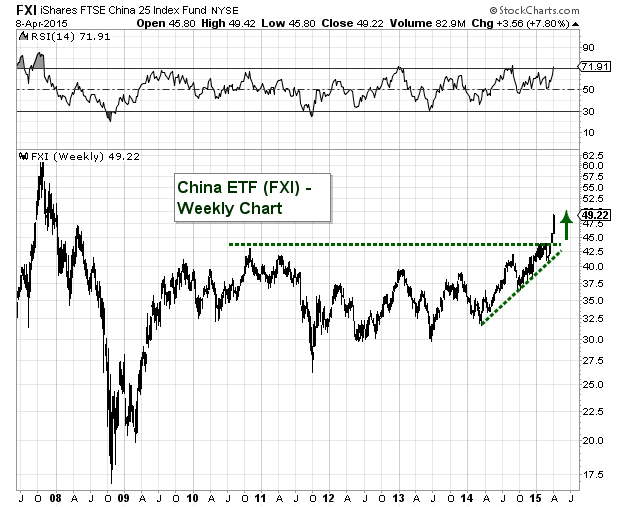
The weekly chart below shows the big gains over the past 18 months, as well as the breakout to new 7 year highs.
iShares China ETF (FXI) Weekly Chart
Follow Andy on Twitter: @andrewnyquist
No position in mentioned securities at the time of publication. Any opinions expressed herein are solely those of the author, and do not in any way represent the views or opinions of any other person or entity.


