From time to time I like to look at various markets from a different perspective, as I am always on the lookout for chart patterns showing breakouts and breakdowns. Earlier this year, I wrote a “Market Masters” article for See It Market showing that sometimes standing on your head can help improve your investment results!
I enjoyed writing that article so much that I thought I’d try it out again. In the chart below, I flipped the S&P 500 and the Russell 2000 upside down and applied the 200 day moving average to both of them.
Here are a couple of takeaways:
1. You can see the S&P 500 has NOT broken above the falling trend line resistance based off the inverted 2009 highs, nor is it above its 200 day moving average line either.
2. The Russell 2000 looks a little different at this time, as it has broken above its trend line resistance off the 2009 highs and is also attempting to push above its 200 moving average line. Is that a Russell 2000 breakout?
S&P 500 and Russell 2000 – Inverted (click to enlarge)
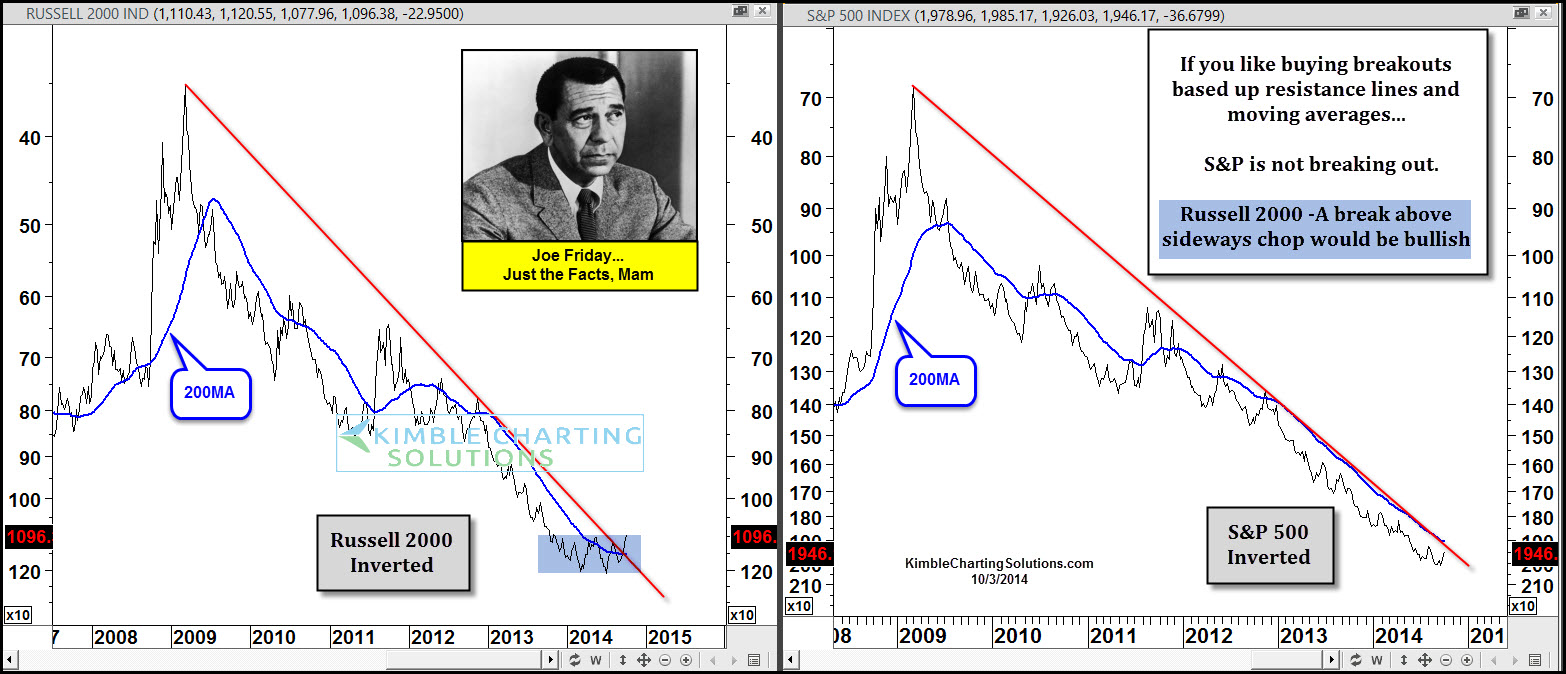
Joe Friday: The Russell 2000 could be building a base over the past 9 months. Should the index break above the blue box, it would be considered a Russell 2000 breakout. Remember that this chart was upside down, so the Short Russell 2000 Fund (RWM) would be an ETF that could rise in price if a breakout occurs on the upside down chart.
No doubt this is a unique way of looking at things, but I think a different perspective is refreshing at times. Thanks for reading.
Read more from Chris on his Blog. Follow Chris on Twitter: @KimbleCharting
No position in any of the mentioned securities at the time of publication. Any opinions expressed herein are solely those of the author, and do not in any way represent the views or opinions of any other person or entity.


