The last time Nvidia (NASDAQ:NVDA) came onto my radar was in 2016, when I highlighted a potential area for a correction. That level held Nvidia (NVDA) at bay for several months, but…
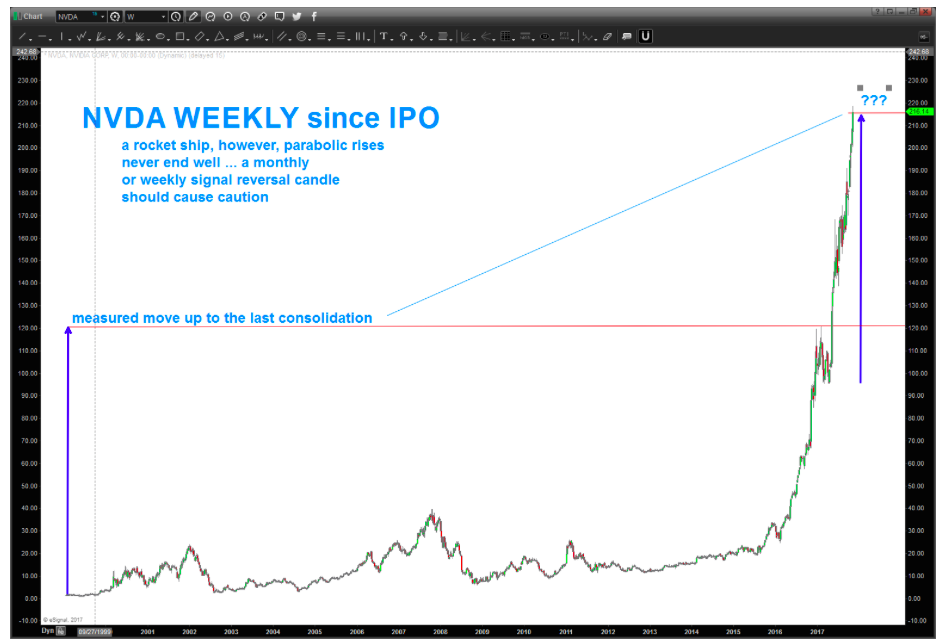
It eventually exploded through that level and has since gone parabolic. Yes folks, Nvidia’s stock price is parabolic.
Stocks that go vertical tend to undergo strong, fast, and deep corrections. Timing a top on these stocks is never easy, so risk-reduction (and stops) are key for those still long.
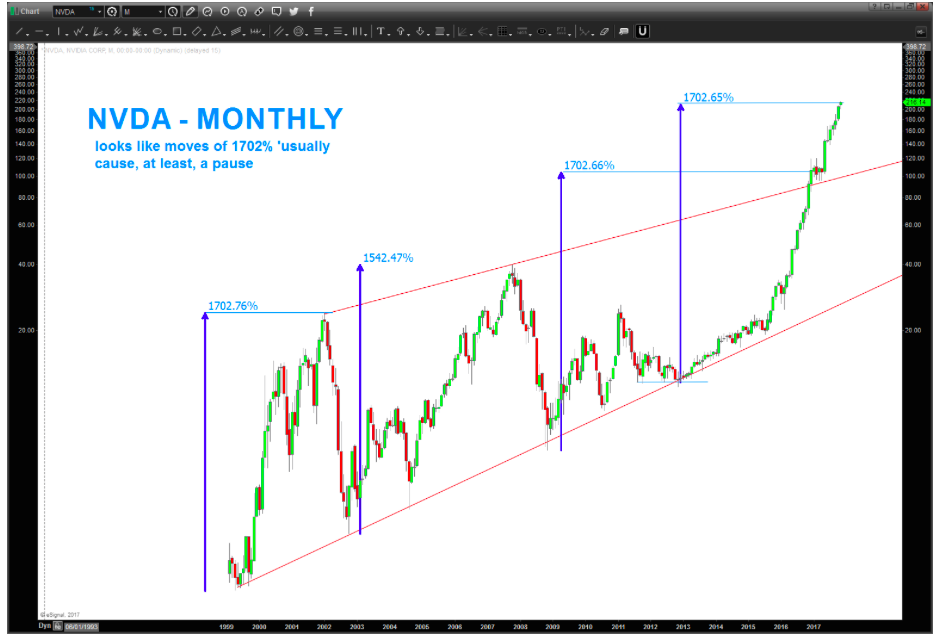
Below are the monthly and weekly charts for NVDA. Note that I used some basic price techniques that show the stock is coming into an area that should produce another pause or pullback. It doesn’t have to (the market owes us nothing), but again, doing things to manage risk with parabolic stocks is key. 1700% move – wow!
When Nvidia’s stock runs out of gas, it will likely be investors who are do the running. Careful here.
Nvidia Stock Charts – Monthly & Weekly Bars
Thanks for reading.
Twitter: @BartsCharts
Author does not have a position in mentioned securities at the time of publication. Any opinions expressed herein are solely those of the author, and do not in any way represent the views or opinions of any other person or entity.


